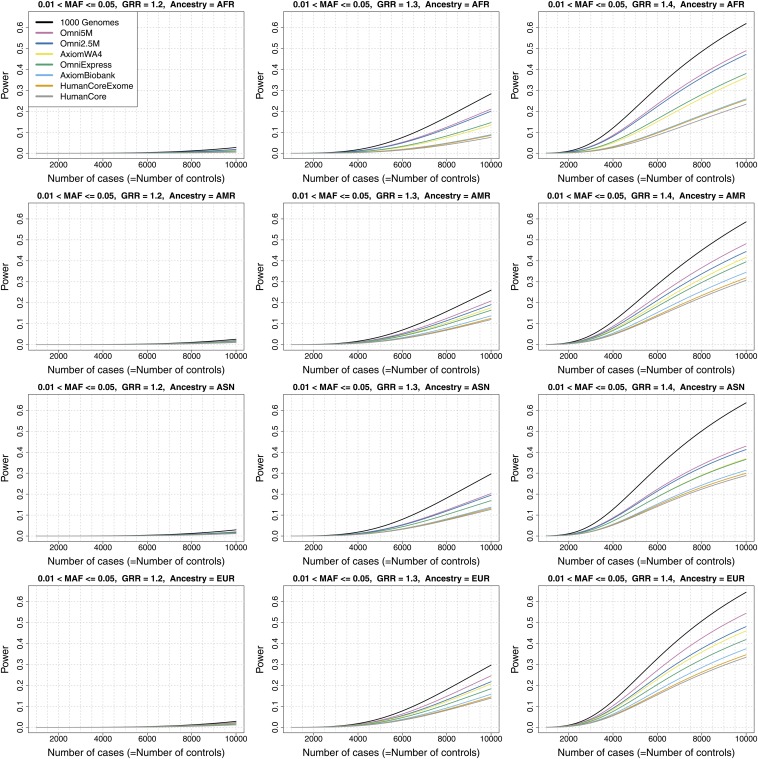
Figure 5.
Genome-wide power estimates for GRR values of 1.2, 1.3, and 1.4, for less common autosomal variants (0.01 < MAF ≤ 0.05). The array Omni2.5+Exome is not shown in these plots because it is indistinguishable at this resolution from the Omni2.5M array. In the legend, “1000 Genomes” refers to a hypothetical array in which all variants in the 1000 Genomes dataset would be typed.

