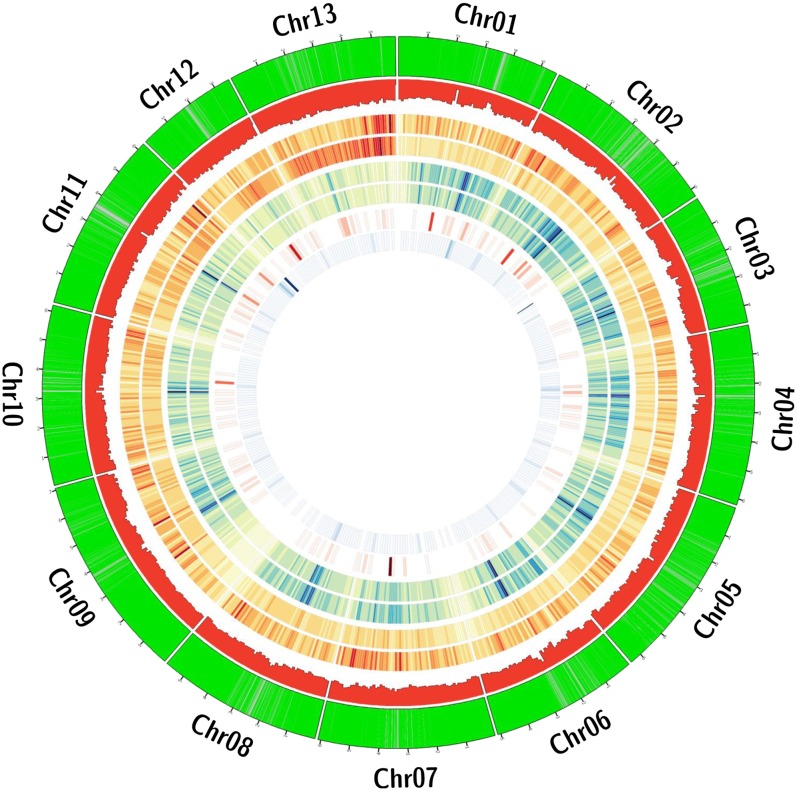
Figure 1.
Plot of genes, homoeo-SNPs, duplications, deletions, and conversion events in the A-genomes, relative to the D5 reference sequence, produced by Circos (Krzywinski et al. 2009). Considering the concentric circles from the outside inward, the outermost (and first) green circle indicates the location of annotated genes. The next circle (red) is a histogram of the number of homoeo-SNPs in a 1-Mbp window throughout the genome. The next two red (high-frequency) to yellow (low-frequency) circles are heat maps showing the location of duplications in the A1 and A2 genomes as compared to the D5 genome (A2 interior). The next two blue (high-frequency) to yellow (low-frequency) circles are heat maps showing the location of deletions in the A1 and A2 genomes as compared to the D5 genome (A2 interior). The final two circles show conversion events in the tetraploid G. hirsutum cv. Maxxa. The first circle shows conversion of loci to the A nucleotide on a red-to-yellow scale, whereas the innermost (and last) circle shows conversion of loci to the D nucleotide on a blue-to-yellow scale.

