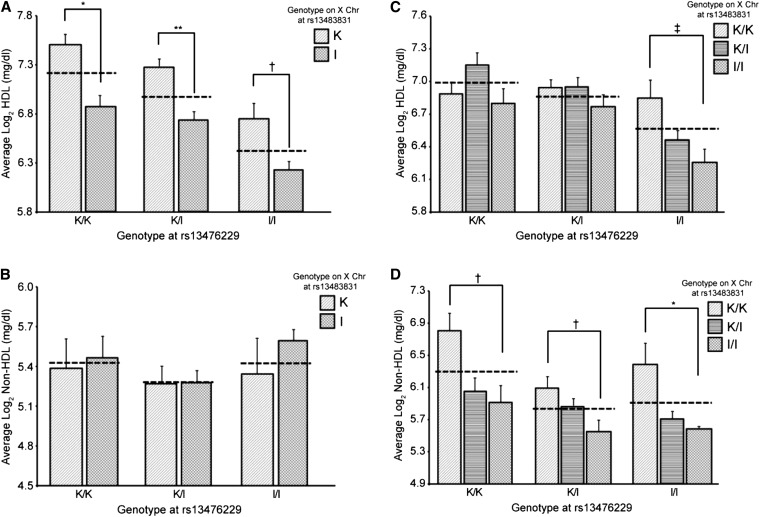
Figure 3.
Plasma lipid values based on sex and the genotypes at markers rs13476229 (Chr 1) and rs13483831 (Chr X). (A, B) males; (C, D) females. (A, C) HDL cholesterol. (B, D) Non-HDL cholesterol. K/K denotes mice homozygous for the KK/HlJ allele, K/I denotes females heterozygous for the KK/HlJ and I/LnJ alleles, and I/I denotes mice homozygous for the I/LnJ allele. Dashed lines represent the average values when only considering the genotype at marker rs13476229. Error bars indicate SEM. ‡P < 0.05, †P < 0.01, *P < 0.001, **P < 0.0001.

