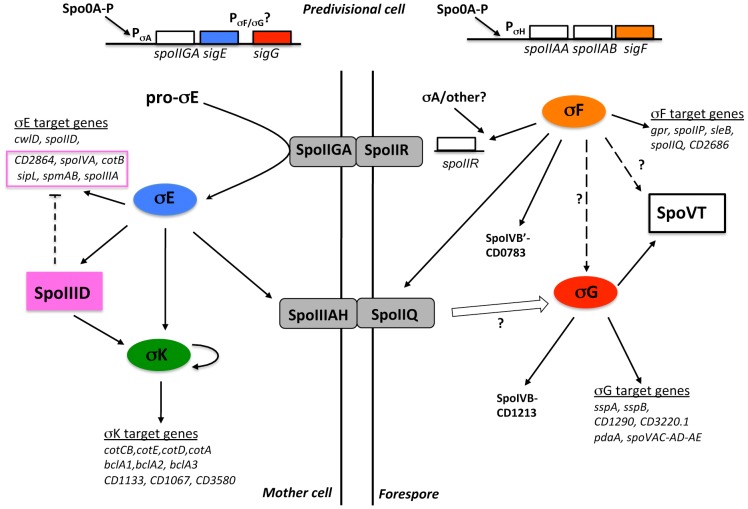
Figure 6. Model of the regulatory network controlling sporulation in C. difficile.
The upper part of the figure represents the cell before asymmetric division. The parallel vertical lines represent the two membranes separating the forespore (right) and the mother cell (left). The four sigma factors of sporulation are encircled (by oval boxes). Precursor protein of σE is indicated as pro-σE. Square boxes correspond to transcriptional regulators. Proteins associated with the membrane or located into the intermembrane space are illustrated as embedded in the parallel vertical lines. Black solid arrows and white arrow indicate activation at the transcriptional level or at the level of protein activity, respectively. Broken arrows with a question mark represent mechanisms that are not yet fully understood. Dotted arrows indicate a possible direct transcriptional activation or repression. The σE target genes under the negative control of SpoIIID are inside a pink box.

