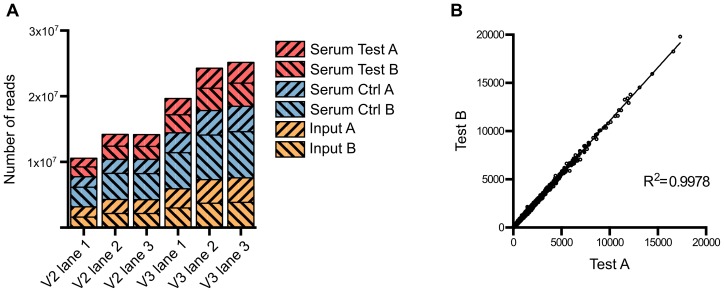
Figure 1. Summary of sequence read data from multiplexed TraDIS.
(A) Number of tagged reads obtained in each lane of TruSeq version 2 and version 3 flowcells. (B) Correlation between the two biological replicates. The number of insertions in each gene from Test A was plotted against that from Test B; the correlation coefficient R2 indicates very low variation between the two replicates.

