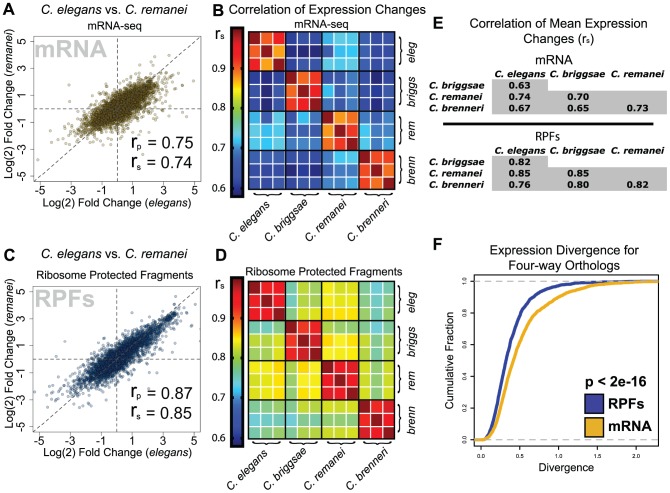
Figure 4. Translatome changes are more similar between species than transcriptome changes.
(A) Comparison of mRNA fold changes for orthologous transcripts in C. elegans and C. remanei. rp = Pearson's correlation coefficient, rs = Spearman's rho. (B) Heatmap of rank correlations of mRNA fold-changes between individual biological replicates for four species. (C–D) Identical figures to A and B using RPF abundance data. (E) Tables of correlation coefficients for species comparisons of mean mRNA and RPF fold changes (mean from three biological replicates; Spearman's rho shown, Pearson coefficients shown in Table S7). (F) Cumulative distributions of expression divergence for mRNA and RPF levels within four-way ortholog groups; p-value: Kolmogorov-Smirnov test.

