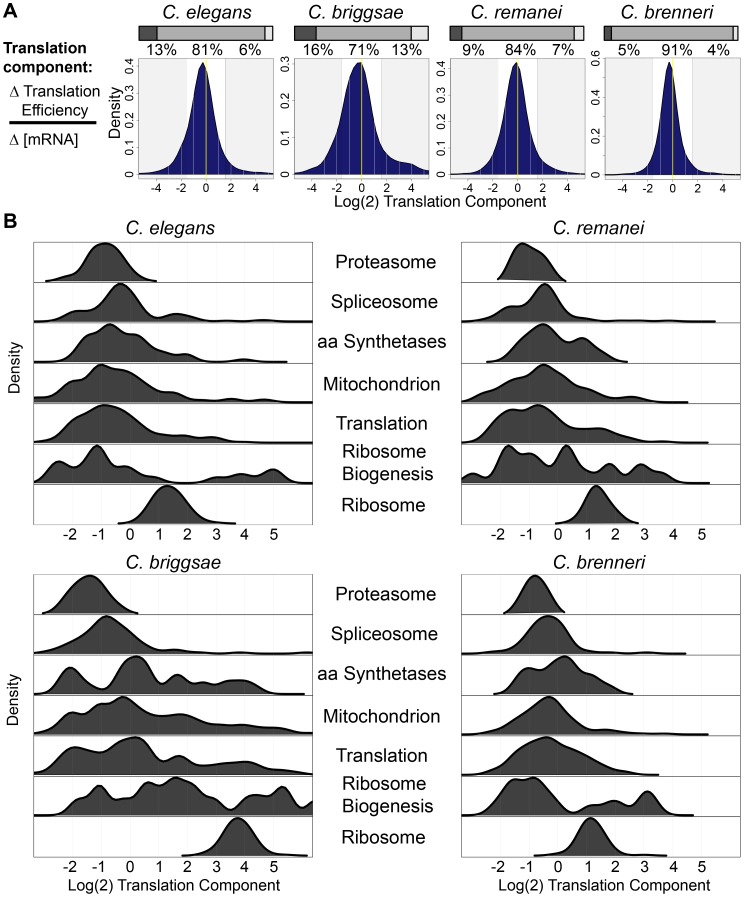
Figure 6. Functionally related gene sets are regulated by similar contributions of translational control and mRNA abundance changes in different species.
(A) The distribution of the translation component of regulation for transcripts differentially-expressed in RPF data (fdr = 0.1) in the four species. Shaded regions correspond to changes that are >75% translational (right) and <25% translational (left). Pairwise comparisons showed statistically significant differences in the distributions between each species pair (p<2.2e-16; Kolmogorov-Smirnov test). The percentage of transcripts falling in these two regions and in between are shown above. Stacked barplots represent the fractions of transcripts in each shaded category. (B) Density distributions of the translational component of regulation for genes in several functional categories in the four species.

