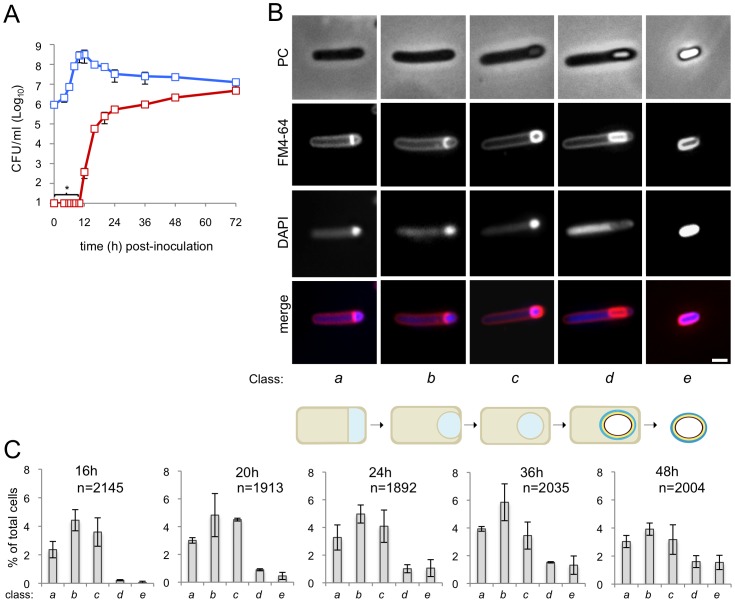
Figure 1. Sporulation in C. difficile 630Δerm.
(A) The spore (red symbols) and total cell titer (blue symbols) was measured for a culture of strain 630Δerm at the indicated times post-inoculation in SM. The data represent the average ± standard deviation (SD) of three independent experiments. No heat resistant CFUs were detected for an undiluted 100 µl culture sample (CFU/ml: ≤101). (B) Samples of an SM broth culture of strain 630Δerm were collected 24 h after inoculation, stained with DAPI and FM4-64 and examined by phase contrast (PC) and fluorescence microscopy. The panel illustrates the stages in the sporulation pathway, according to the classes defined in the text and represented schematically at the bottom of the panel (see the Results section). Scale bar, 1 µm. (C) Quantification of the percentage of cells in the morphological classes represented in (B) (as defined in the text), relative to the total viable cell population, for strain 630Δerm at the indicated times following inoculation in SM broth. The data represent the average ± SD of three independent experiments. The total number of cells scored (n) is indicated in each panel.

