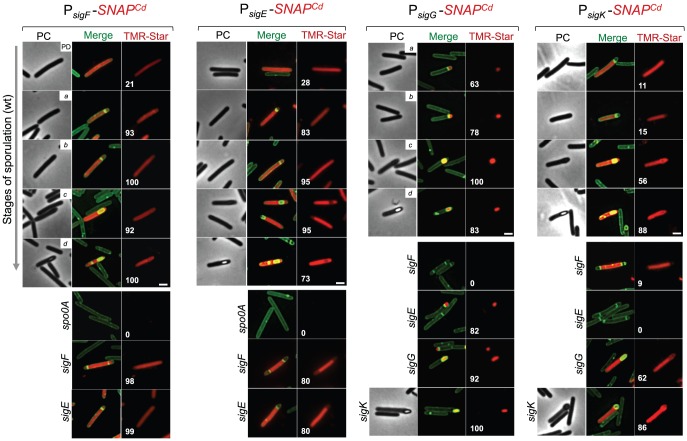
Figure 4. Temporal and cell type-specific expression of sigF, sigE, sigG and sigK during sporulation.
Microscopy analysis of C. difficile cells carrying fusions of the sigF, sigE, sigG and sigK promotors to SNAPCd in strain 630Δerm (wt) and in the indicated mutants. The cells were collected after 24 h of growth in SM liquid medium, stained with TMR-Star and the membrane dye MTG, and examined by phase contrast (PC) and fluorescence microscopy to monitor SNAP production. The merged images shows the overlap between the TMR-Star (red) and MTG (green) channels. The panels are representative of the expression patterns observed for different stages of sporulation, ordered from early to late for the wild type strains according to the morphological classes a-d defined in Figure 1, as indicated. For the sig strains, the morphological stage characteristic of each mutant is indicated. An extra class that accounts for pre-divisional cells (PD) was introduced for the analysis of both sigF and sigE transcription. The numbers refer to the percentage of cells at the represented stage showing SNAP fluorescence. The data shown are from one representative experiment, of three performed independently. The number of cells analysed for each class, n, is as follows: PD, n = 100–150; class a, n = 30–50; class b, n = 50–60; class c, n = 30–40; class d, n = 15–25; for sigF/E mutants, n = 80–120; for sigG and sigK mutants, n = 40–50. Scale bar: 1 µm.

