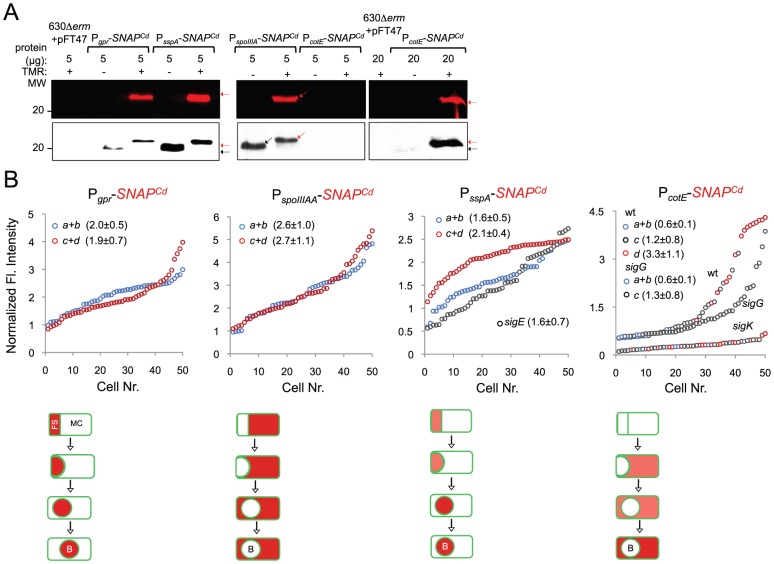
Figure 7. Quantitative analysis of sigF, sigE, sigG and sigK activities during sporulation.
(A) SDS-PAGE gel and Western Blot analysis of extracts from 630Δerm carrying fusions of gpr, spoIIIAA, sspA and cotE to SNAP. Black arrows point to unlabeled SNAPCd protein, while red arrows point to SNAP after TMR-Star labeling (distinguishable in the WB from the unlabeled form by a shift in protein migration). The TMR-Star fluorescent signal from the SDS-PAGE gel was obtained using a fluorimager. TMR-Star incorporation as well as the amount of protein loaded is indicated for each lane. 630Δerm carrying pFT47 empty vector was used as a negative control of SNAP production. (B) Quantitative analysis of the SNAP fluorescence (Fl.) signal in different cell types of the reporter strains for σF, σE, σG and σK activity, as indicated. The numbers in the legend represent the average ± SD of fluorescence intensity for the cell class considered (NB: 50 cells were analysed for each cell type). The average fluorescence intensity (all classes included) from PcotE-SNAPCd is 1.9±1.3 for the wild type, 1.3±0.8 for a sigG mutant and 0.3±0.1 for the sigK mutant. Data shown are from one experiment, representative of three independent experiments. Schematic representation of the deduced spatial and temporal pattern of transcription is shown for the different fusions (with darker red denoting increased transcription). The cell membrane is represented in green. No activity was seen in predivisional cells for any of the σ factors (not represented). PD, pre-divisional cell; MC, mother cell; FS, forespore; B, phase bright spore; a to d: sporulation classes ordered and defined as in the legend for Figure 4.

