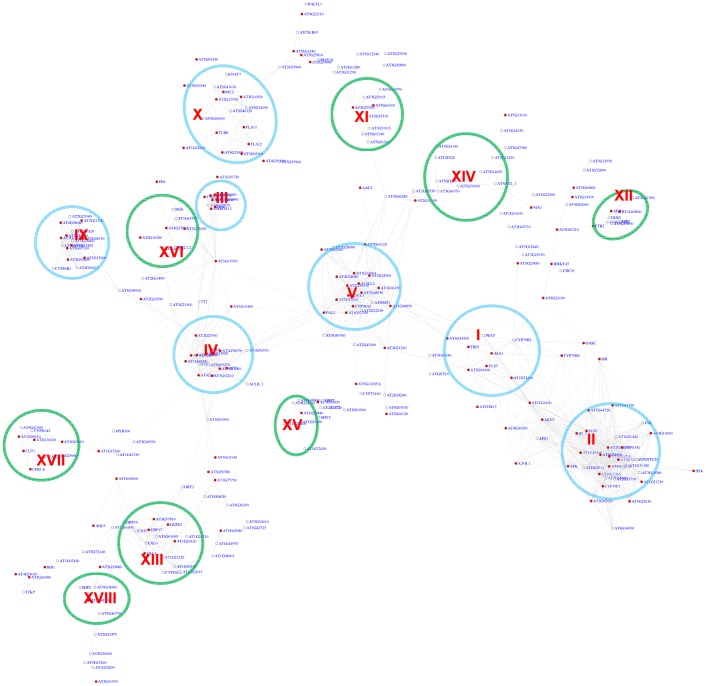
Figure 5. A sub-network for the MYB motifs based on motif position bias analysis.
Genes were identified in the motif position analysis with z-score> = 2.2. Sixteen modules were identified. Among them, 7 modules (circled in blue) were also identified via the motif enrichment analysis (See Figure 4), while 8 modules (circled in green) represent additional modules identified via the motif position analysis. Red nodes – genes whose promoters contain the MYB motif; white nodes – genes whose promoters lack the MYB motif.

