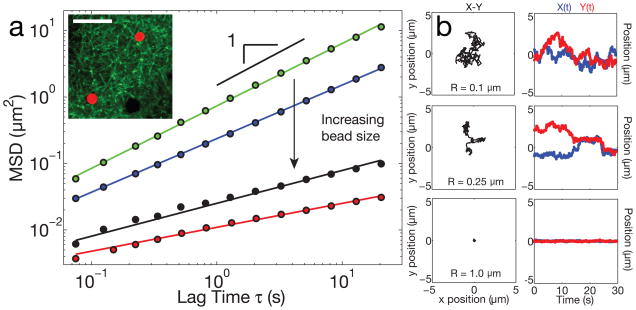
Figure 1. Probe particle size-dependent dynamics within the GV.
a, 2D Mean squared displacement of passivated probe particles in GVs from large oocytes (Stage V–VI). Particles of radius R=0.1 μm (green) exhibit diffusive-like motion with a diffusive exponent, α ≈1.0 (24 z-positions from 9 GVs, 10,648 particles identified). For larger bead sizes, the mobility becomes increasingly constrained, with correspondingly smaller values of α. Blue: R=0.25 μm (16 z-positions from 8 GVs, 2,053 particles identified), black: R=0.5 μm (19 z-positions from 6 GVs, 1,867 particles identified), red: R=1.0 μm (35 z-positions from 14 GVs, 3,011 particles identified). Inset shows Lifeact::GFP network (green) and R=1.0 μm probe particles (red); dark spheres are unlabeled RNP bodies; scale bar = 10 μm. b, Left column shows example X-Y trajectories for three different bead sizes. The right column shows corresponding temporal changes in position, X(t) and Y(t).

