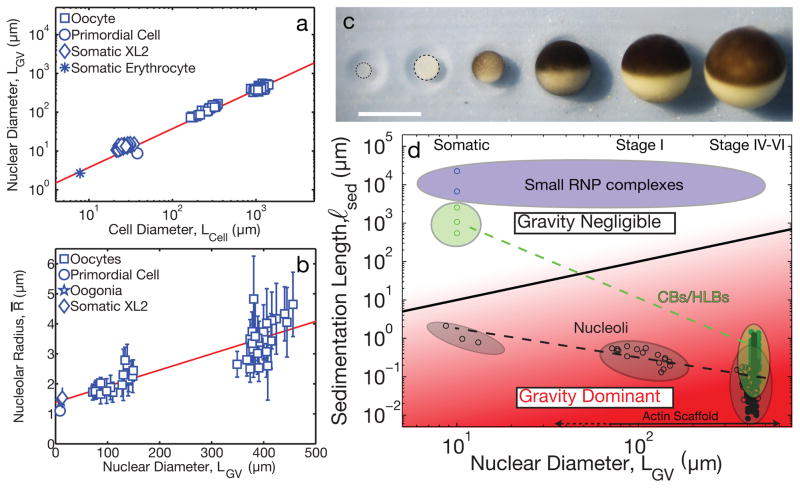
Figure 5. Cell size, organelle scaling, and gravity.
a, Linear scaling was observed between nuclear diameter, LGV, and cell diameter, Lcell from Stage I, IV, V, and VI oocytes and estimated from the literature (Supplementary Note). b, Linear scaling found between average nucleolar radius and nuclear diameter based on measurements in Stage I, IV, V and VI oocytes and estimated from literature (Supplementary Note). Nucleoli were measured from late stage oocytes (n=8 GVs), intermediate stage oocytes (n=17 GVs) and early stage oocytes (n=17 GVs). Error bars = s.d. Red solid line is the weighted best-fit line of the data. c, Cell growth during oogenesis in X. laevis. Each of the six stages is shown. Scale bar = 1 mm. d, State diagram of ℓsed vs. LGV. Black solid line separates region where gravity is negligible (white, ℓsed > LGV) from region where gravity dominates (red, ℓsed < LGV). Measurements (closed circles) and approximations (open circles) (Supplementary Note) are plotted for different nuclear bodies (black: nucleoli, green: HLBs/CBs, blue: small RNP complexes). For nuclear diameters > 10 μm, gravity becomes increasingly dominant for both HLBs and nucleoli, requiring a stabilizing F-actin scaffold.

