Figure 7.
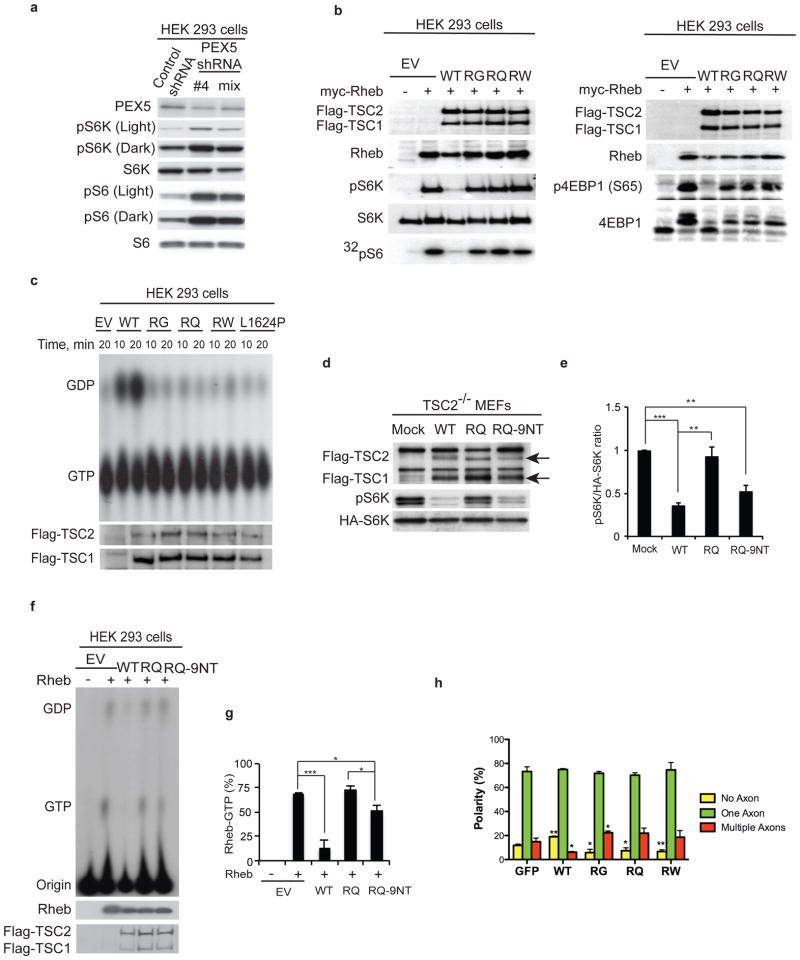
TSC2 functions at the peroxisome to repress mTORC1. (a) HEK 293 cells were transfected with either control shRNA or a PEX5 targeting shRNA, and lysates were blotted using pS6K (T389), S6K, pS6 (S235/236) and S6 antibodies. (b) TSC2 functional assay was performed in HEK 293 cells co-expressing myc-Rheb, Flag-TSC1 and Flag-TSC2 wild type (WT), or Flag-TSC2 mutants (RG, RQ and RW) and HA-S6K (left panel) or HA-4EBP1 (right panel). Cells transfected with empty vector (EV) with or without myc-Rheb were used as controls. Lysates were further analyzed for phospho-S6K (T389), S6K, phospho-4EBP1 (S65), 4EBP1 and 32P-incorporation into S6. (c) Rheb GTPase activity assays was performed by co-immunoprecipitating TSC heterodimers from HEK 293 cells expressing Flag-TSC1 and Flag-TSC2 wild type (WT), Flag-TSC2 mutants (RG, RQ and RW), or Flag-TSC2 GAP-mutant (L1624P) performed for the indicated time. (d) TSC2 functional assay was performed using TSC2−/− MEFs co-transfected with Flag-TSC1, HA-S6K, and Flag-TSC2 wild type (WT) or Flag-TSC2 mutants (RQ or RQ-9NT), with mock transfected cells as controls. Arrows denote the positions of Flag-TSC1 and Flag-TSC2. (e) Quantitation of the ratio of phospho-S6K to total HA-S6K from Fig 7d. (±s.e.m., n = 3 independent experiments). *p < 0.05, **p < 0.01. (f) In vivo guanine nucleotide loading assays of Rheb was measured using HEK 293 cells overexpressing Flag-TSC1 and Flag-TSC2 wild type (WT), or Flag-TSC2 mutants (RQ and RQ-9NT) with or without Rheb as indicated. (g) Graph shows quantitation of the percentage of Rheb bound to GTP (indicative of Rheb GTPase activity, ±s.e.m., n = 4 independent experiments). *p < 0.05, ***p < 0.001. (h) Quantification of axon number in hippocampal neurons co-transfected with GFP, Flag-TSC1 and Flag-TSC2 WT or Flag-TSC2 mutants (RG, RQ, and RW). No axons = yellow, one axon = green, and multiple axons = red. Quantification was performed on 150–250 neurons from each of the 3 independent experiment and the results are represented as polarity (%). All error bars represent s.e.m., *p < 0.05, ** p < 0.01 compared to GFP only transfected control. Uncropped images of western blots are shown in Supplementary Fig. S6. Source data of statistical analysis are shown in Supplementary Table S1.

