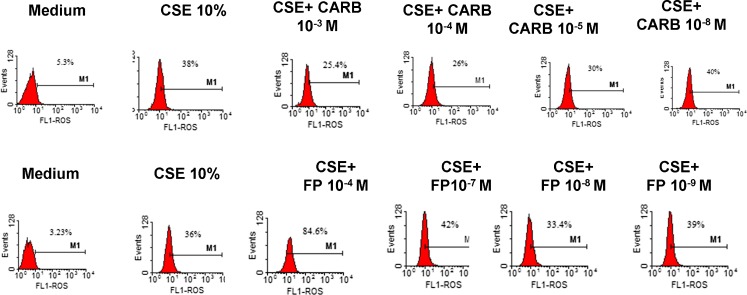
Fig. 2.
Dose–response experiments for CARB and FP. 16-HBE cells were cultured in the presence and absence of CSE (10 %), CARB (10−3, 10−4, 10−5 and 10−8 M) and FP (10−4, 10−7, 10−8 and 10−9 M) for 18 h and then were used for assessing ROS production using flow cytometry (see “Materials and methods” for details). Representative histogram plots from two experiments are shown

