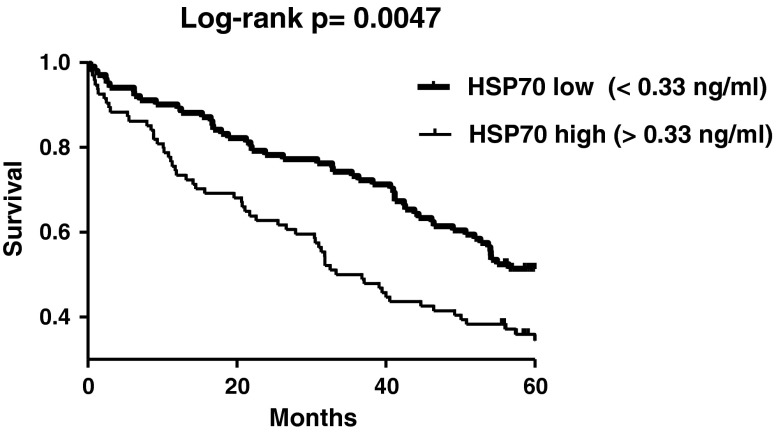
Fig. 1.
Kaplan–Meier survival plots in the two subgroups of HF patients stratified according to median HSP70 (HSPA1A) levels. The p value of the log-rank test is indicated. Survival times were measured from inclusion until the end of follow-up. Survival was plotted according to the Kaplan–Meier method, and differences in survival between the groups were compared with the log-rank test. The power of the log-rank test was sufficiently high (p = 0.9, alpha = 0.05) to support the above conclusion

