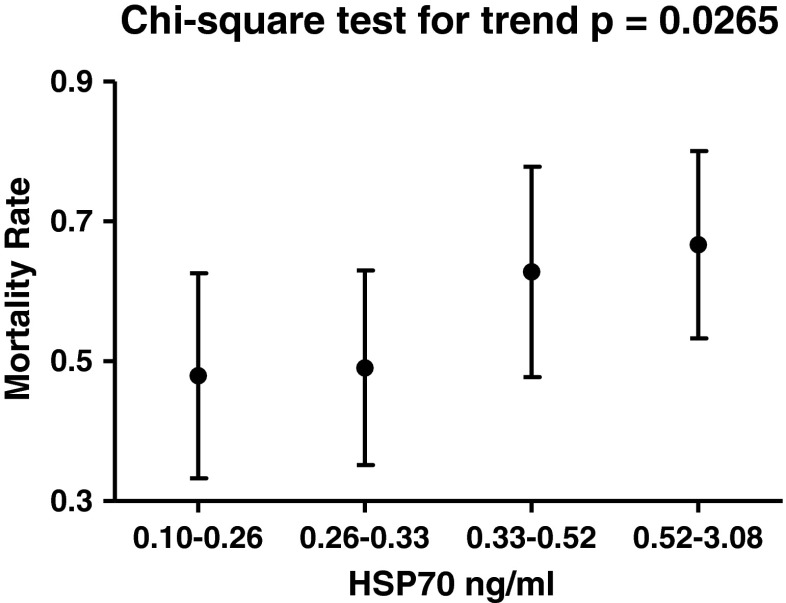
Fig. 2.
Mortality rates (95 % CI) in the four subsets of HF patients stratified according to HSP70 (HSPA1A) levels (25th percentile, median, and 75th percentile). The p value obtained by the chi-square test for trend is indicated (chi-square = 4.92, degrees of freedom = 1). The patients were contacted between the 56th and 60th months (median, 60 months) after study entrance. The primary outcome measure was the death of the patient from any cause. We ascertained the death of the patients reported by their family members or the medical staff by checking the data of the national health registry. To compare mortality rates, we calculated person-time incidence rates in the four subsets with different ranges of HSP70 level: 0.10–0.26 ng/ml (9.58 deaths per 100 person-years), 0.26–0.33 ng/ml (9.81 deaths per 100 person-years), 0.33–0.52 ng/ml (12.55 deaths per 100 person-years), and 0.52–3.08 ng/ml (13.33 deaths per 100 person-years)

