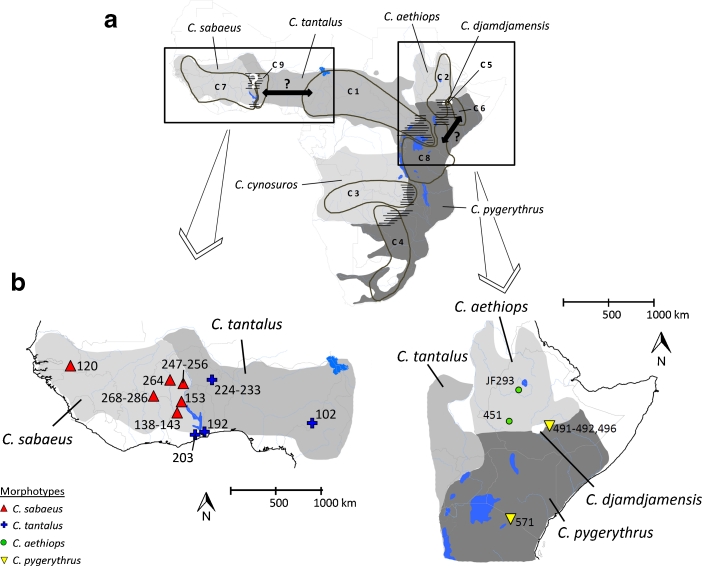
Fig. 1.
Distribution map of African green monkeys (Chlorocebus spp.). (a) Distribution of mitochondrial DNA (mtDNA) clades and presumed hybridization in contemporary contact zones (hatched areas) according to Haus et al. (2013). Black arrows indicate possible ancient introgression events we test in this study. Possible hybridization in the West African contact zone is indicated with a white question mark. (b) Collection sites for samples of morphotypes from West and East Africa used in this study.

