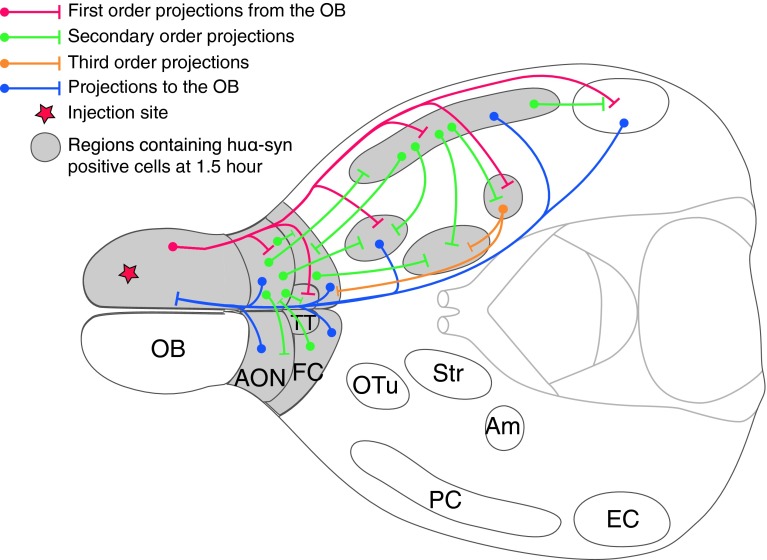
Fig. 9.
Schematic diagram summarizing both the olfactory neural network and regions where huα-syn-positive cells are detected after injection into the OB. This schematic horizontal section of the brain illustrate some of the important regions connected to the OB. Red, green, yellow and blue pathways schematically represent connections within the olfactory system. Circular endpoint of pathways represents the cell body of a relay neuron and a strait end represents the axonal terminal. Structures filled with grey represent regions that displayed huα-syn-positive cells 1.5 h after injection of monomeric and oligomeric tα-syn. All those regions are directly, or indirectly connected to the OB by centrifugal or centripetal projections

