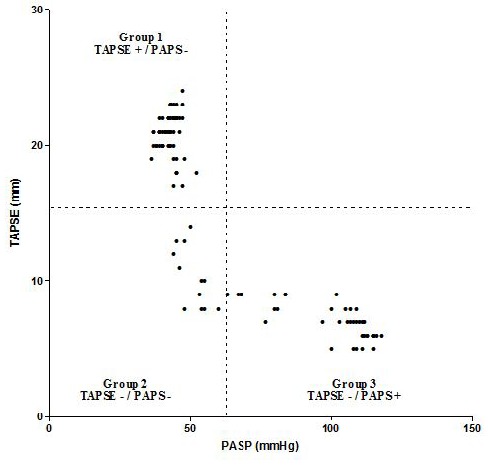
Figure 2.

Distribution of patients according to tricuspid annular plane systolic excursion (TAPSE) and pulmonary artery systolic pressure (PASP) values at the admission. Dotted lines represent the mean values of TAPSE and PASP and divide the population in 3 Groups.
