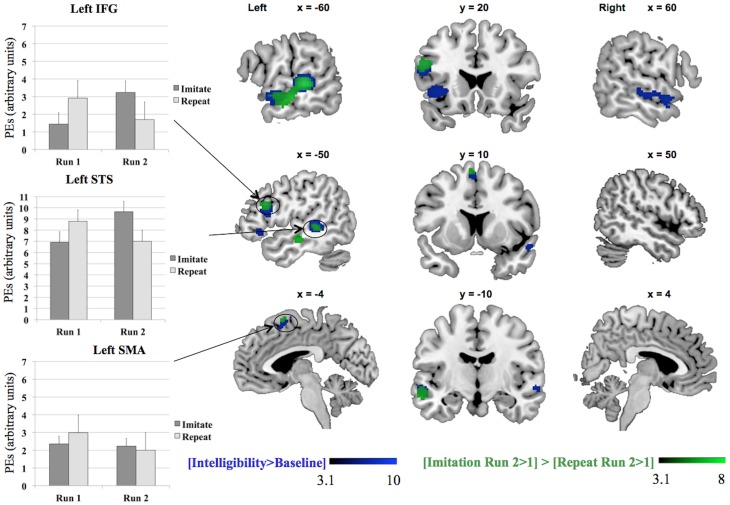
Figure 3.
Results for the whole-brain analysis for the contrasts [Intelligibility > Baseline] and [Imitation Run 2 > 1] > [Repeat Run 2 > 1], including plots of the parameter estimates (PEs) per group, IFG = Inferior Frontal Gyrus, SMA = Supplementary Motor Area, STS = Superior Temporal Sulcus. The MarsBaR toolbox (Brett et al., 2002) was used to construct spheres, each with a radius of 10 mm, Left IFG (−50 18 26), left SMA (−4 10 64), and left STS (−62 −32 2). The parameter estimates in the three charts represent summary time courses per sphere. The legends represent Z-scores.

