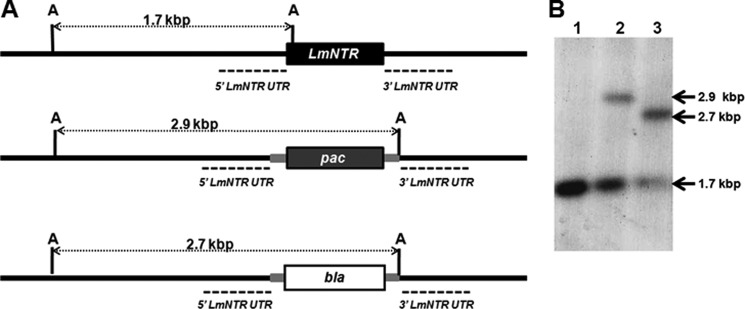
FIGURE 3.

Disruption of LmNTR in L. major. A, diagram of the LmNTR alleles and the effects of gene disruption. 5′- and 3′-untranslated regions (dashed line) immediately upstream and downstream of LmNTR (black box) were amplified and cloned sequentially on either side of a puromycin (pac; dark gray box) or blasticidin (bla; white box) cassette containing T. brucei tubulin intergenic elements required for processing of mRNA (light gray boxes). The position of the predicted ApaI (A) sites plus the band sizes (in kbp) obtained after hybridization are shown. B, autoradiographs of ApaI-digested genomic DNA from L. major (lane 1), LmNTR+/−PAC and LmNTR+/−BLA heterozygous clones (lanes 2 and 3, respectively). Blots were hybridized with labeled 5′-untranslated region of LmNTR. Sizes given are in kbp.
