
FIGURE 5.
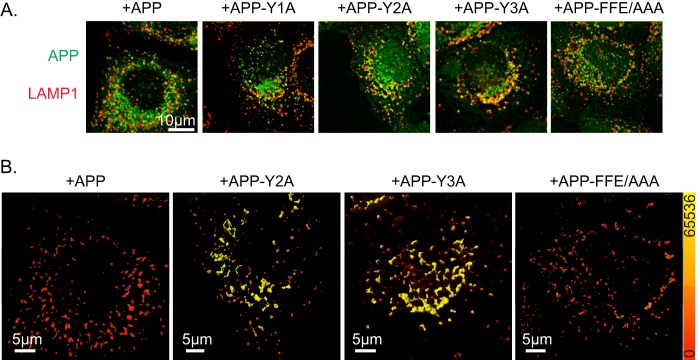
APP-Y3A or APP-Y2A display increased overlap with LAMP1 at steady state. HeLaM cells were transfected with the APP mutants indicated. The next day, cells were fixed and stained with antibodies against APP and LAMP1. A, maximum intensity projections of wide field images are shown. B, images shown in A were imported into Imaris, and isosurfaces were generated based on LAMP1 staining. Isosurfaces were then falsely colored with a heat map (shown on right, ranging from 0 to 65,536) indicating the sum intensity of APP staining within the isosurfaces.