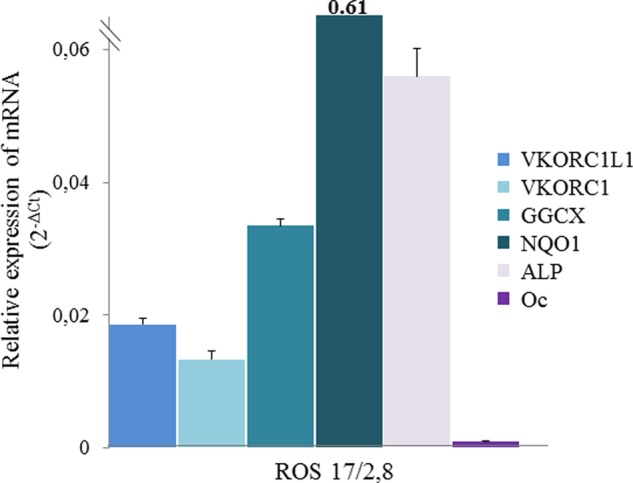
FIGURE 4.

Analysis of expression of VKORC1, VKORC1L1, GGCX, and NQO1 in osteoblastic cells ROS 17/2.8 cells. ROS cells were cultured in DMEM supplemented with 10% FBS and 100 units/ml penicillin/streptomycin. Total RNA isolated from ROS cells was used to quantify by real-time PCR mRNA expression for the four enzymes involved in the vitamin K cycle and for OC and alkaline phosphatase (ALP). Each data point represents the mean of four different cultures of ROS 17/2.8 cells ± S.D. (error bars). Three separate determinations were made for each culture.
