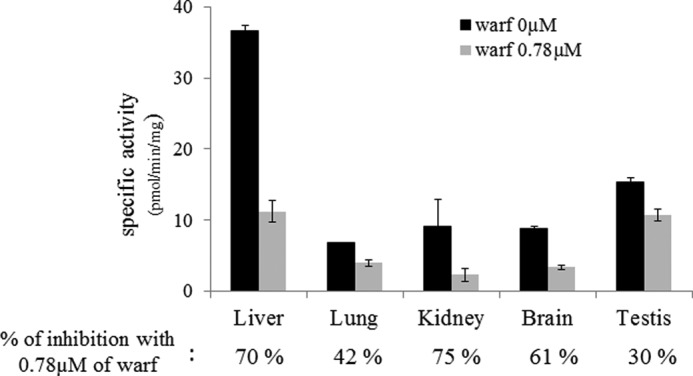
FIGURE 8.

Analysis of VKOR activity in different tissues of male OFA Sprague-Dawley rats. VKOR activity was evaluated in the presence of 200 μm vit K1>O with 0 or 0.78 μm warfarin. Each bar represents the mean ± S.D. (error bars) of three individual determinations. Percentages of inhibition of the VKOR activity with 0.78 μm warfarin are indicated below each tissue tested.
