FIGURE 11.
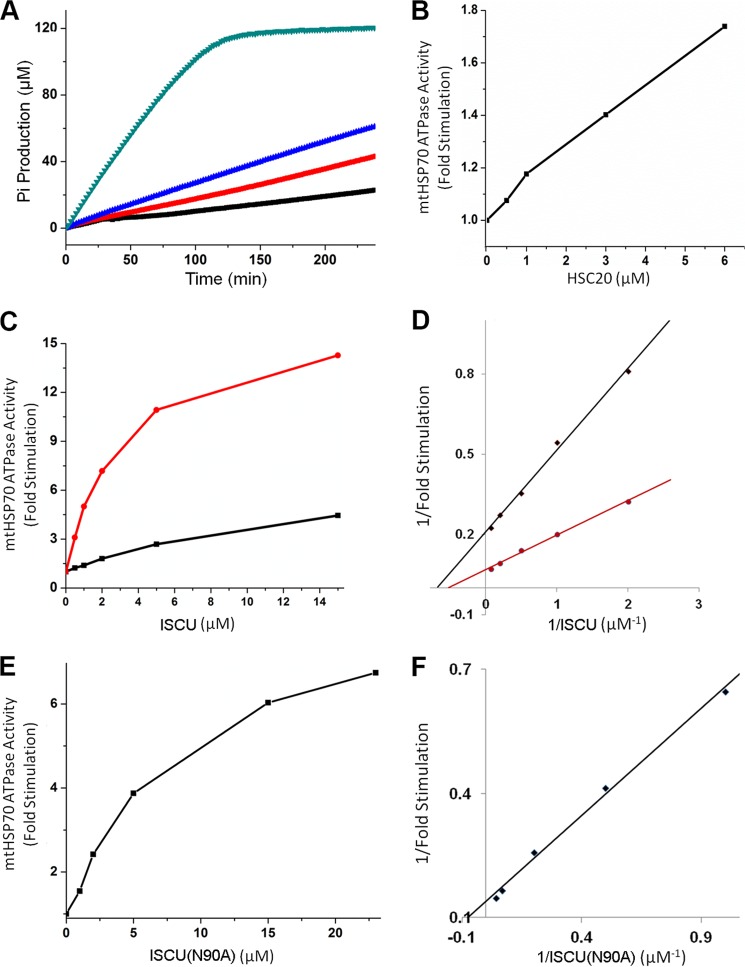
Stimulation of the ATPase activity of mtHSP70 at 25 °C by ISCU and HSC20. A, time course of ATP hydrolysis catalyzed by 1 μm mtHSP70 alone (black line) in the presence of 6 μm HSC20 (red line), in the presence of 15 μm ISCU (blue line), or in the presence of 4 μm HSC20 + 15 μm ISCU (green line). B, ATPase activity of 1 μm mtHSP70 as a function of added HSC20. C, ATPase activity of 1 μm mtHSP70 as a function of added ISCU in the absence of HSC20 (black line) and in the presence of 4 μm HSC20 (red line). D, double-reciprocal plot of the data of C. E, ATPase activity of 1 μm mtHSP70 as a function of added ISCU(N90A) in the presence of 5 μm HSC20. F, double-reciprocal plot of the data of Fig. 11E.

