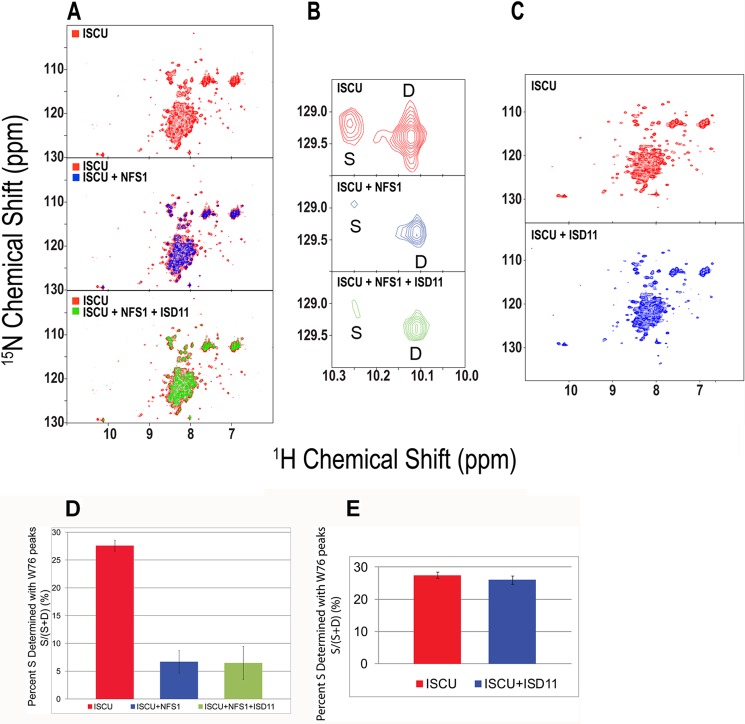
FIGURE 4.
Evidence that NFS1 binds preferentially to the D-state of ISCU. A, top panel, two-dimensional 1H,15N HSQC spectrum of U-15N-ISCU. Middle panel, overlay of the two-dimensional 1H,15N TROSY-HSQC spectra of U-15N-ISCU alone (red) and U-15N-ISCU (blue) mixed with a stoichiometric amount of unlabeled NFS1. Bottom panel, overlay of two-dimensional 1H,15N TROSY-HSQC spectra of U-15N-ISCU (red) and the same sample mixed with stoichiometric amounts of unlabeled NFS1 and ISD11 (green). B, expansions show the 1H,15N peaks from the indole ring of Trp-76 of ISCU. Top panel, U-15N-ISCU. Middle panel, U-15N-ISCU mixed with equimolar unlabeled NFS1. Bottom panel, U-15N-ISCU mixed with equimolar unlabeled NFS1 and ISD11. C, top panel, two-dimensional 1H,15N HSQC spectrum of U-15N-ISCU. Bottom panel, two-dimensional 1H,15N HSQC spectrum of U-15N-ISCU mixed with equimolar unlabeled ISD11. All NMR spectra were collected at 600 MHz (1H) at 25 °C with samples at pH 8.0. D and E, %S calculated by FMLR analysis of the intensities of Trp-76 cross-peaks assigned to the S- and D-states under the conditions indicated.

