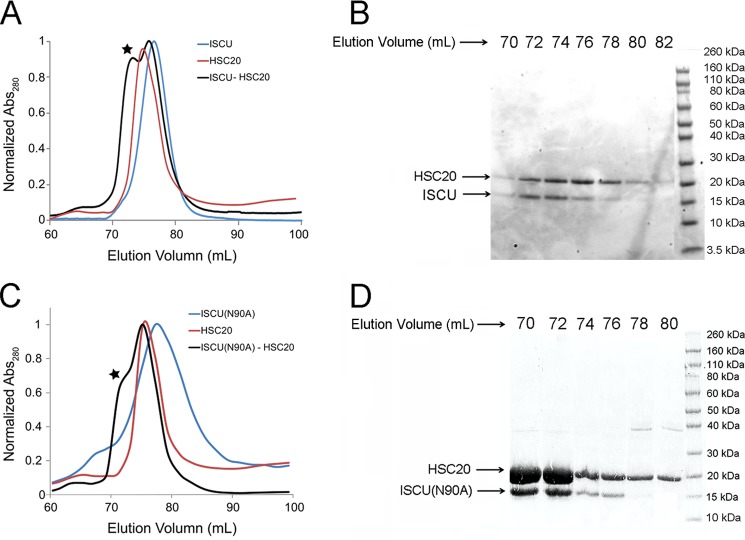
FIGURE 7.
Analytical gel filtration and SDS-PAGE show interaction between HSC20 and ISCU variants. A, analytical gel-filtration elution profiles of ISCU alone (blue line), HSC20 alone (red line), and 2:1 mixture of HSC20:ISCU (black line). The peak at ∼70 ml elution volume (indicated by the star) is assigned to the HSC20-ISCU complex. B, SDS-PAGE of the gel-filtration elution fractions collected between 70 and 80 ml from the 2:1 HSC20:ISCU sample. The protein bands at ∼20 and ∼15 kDa correspond to HSC20 and ISCU, respectively. C, analytical gel-filtration elution profiles of ISCU(N90A) alone (blue line), HSC20 alone (red line), and 2:1 mixture of HSC20:ISCU(N90A) (black line). D, SDS-PAGE of the gel-filtration elution fractions collected between 70 and 82 ml from the 2:1 HSC20:ISCU(N90A) sample. The protein bands at ∼20 and ∼15 kDa correspond to HSC20 and ISCU(N90A), respectively.

