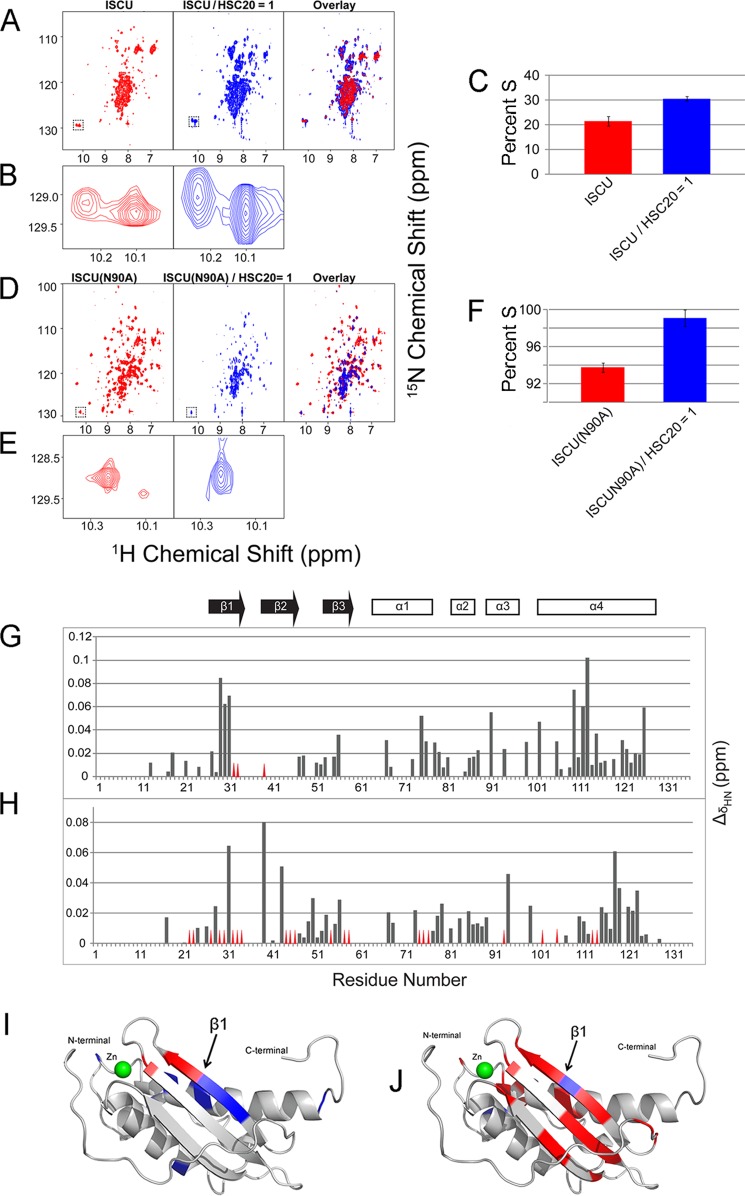
FIGURE 8.
Interaction between HSC20 and ISCU. A, two-dimensional 1H,15N TROSY-HSQC spectra of U-15N-ISCU (left panel), U-15N-ISCU in the presence of equimolar unlabeled HSC20 and diluted by a factor of 2.25 (middle panel), overlay of the NMR spectra from the left and middle panels (right panel). B, expansions of the Trp-76 1H,15N peaks from the spectra in A. C, %S calculated from FMLR analysis of the intensities of the Trp-76 cross-peaks assigned S and D under the conditions indicated. D, 1H,15N TROSY-HSQC spectra of U-15N-ISCU(N90A) (left panel), U-15N-ISCU(N90A) in the presence of 1 eq of unlabeled HSC20 and diluted by a factor of 2.25 (middle panel), overlay of the NMR spectra from the left panel and middle panels (right panel). E, expansions of the Trp-76 1H,15N peaks from the spectra in D. F, %S calculated from FMLR analysis of the intensities of Trp-76 cross-peaks assigned S and D under the conditions indicated. G, chemical shift perturbation of ISCU signals (ΔδHN) upon the addition of 1.0 eq of HSC20 plotted as a function of ISCU residue number. Red triangles indicate residues whose NMR peaks were broadened beyond detection upon addition of HSC20. H, chemical shift perturbations (ΔδHN) for residues of ISCU(N90A) upon the addition of 1 eq of HSC20. I, chemical shift perturbations of ISCU signals resulting from HSC20 binding mapped onto the structure of Zn2+ bound M. musculus ISCU (PDB code 1WFZ) (47). Residues with ΔδHN > 0.04 ppm are colored blue; residues whose NMR peaks were broadened beyond detection are colored red. J, chemical shift perturbations of ISCU(N90A) resulting from HSC20 binding mapped on the structure of Zn2+ bound M. musculus ISCU with color coding as in I.

