FIGURE 9.
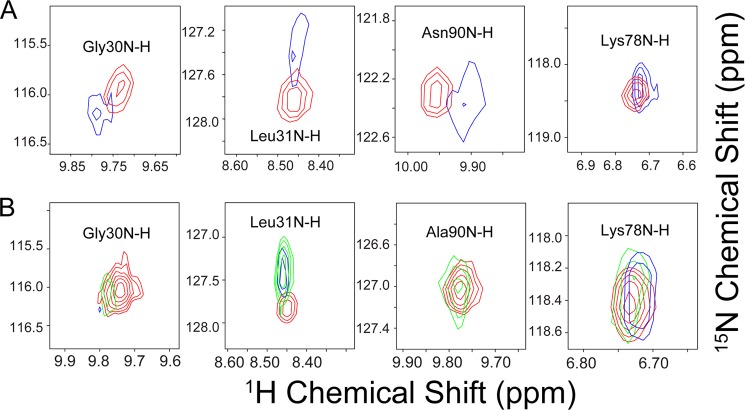
Two-dimensional backbone 1H,15N NMR peaks from U-15N-ISCU variants corresponding to selected residues (Gly-30, Leu-31, Asn-90, and Lys-78, from left to right) that exhibit chemical shift changes upon binding HSC20. A, U-15N-ISCU alone (red) and with 1.0 eq of unlabeled HSC20 (blue). B, U-15N-ISCU(N90A) alone (red) and with 0.5 eq (green) and 1.0 eq (blue) of unlabeled HSC20.

