FIGURE 7.

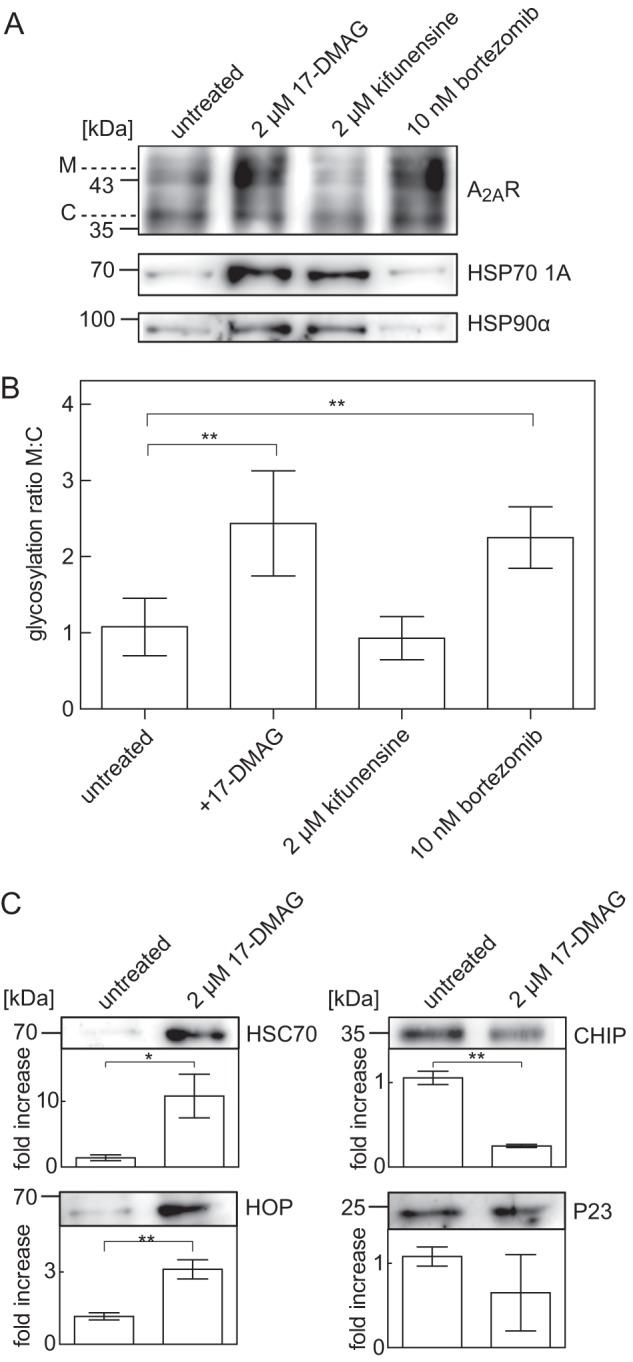
Formation of receptor-chaperone complexes in the absence and presence of inhibitors of HSP90, mannosidase, and the proteasome. A, HEK293 cells stably expressing the tagged receptor FS2-N-A2AR were incubated for 24 h in the absence (untreated; lane 1) or presence of 17-DMAG (2 μm; lane 2), kifunensine (2 μm, lane 3), or bortezomib (10 nm; lane 4). After membrane solubilization and immunoprecipitation, volume-corrected aliquots (i.e. corresponding to 2.5 × 10⁵ cells) of their co-affinity precipitation products were immunoblotted for A2A receptor (A, top), HSP70-1A (A, middle), and HSP90α (A, bottom). B, immunoblots done as in A (top) were analyzed with ImageJ. The ratio of mature (M) and core (C) glycosylated species was determined and normalized by setting the mean ratio observed in untreated control cells as 1. Data are means from four independent experiments; error bars, S.D. Statistical significance was assessed by analysis of variance (**, p < 0.01). C, the A2A receptor was immunoprecipitated from cells that had been incubated in the presence and absence of 17-DMAG (2 μm) as in A. The levels of HSC70 (C, top), HOP (C, second from top), P23 (C, third from top), and CHIP (C, bottom) were determined by immunoblotting and quantified with ImageJ. The pixel density of each band was determined and normalized by setting the mean density observed in untreated control cells as 1. Data are means from three independent experiments; error bars, S.D. Statistical significance was assessed by an unpaired t test (*, p < 0.05; **, p < 0.01).
