FIGURE 4.
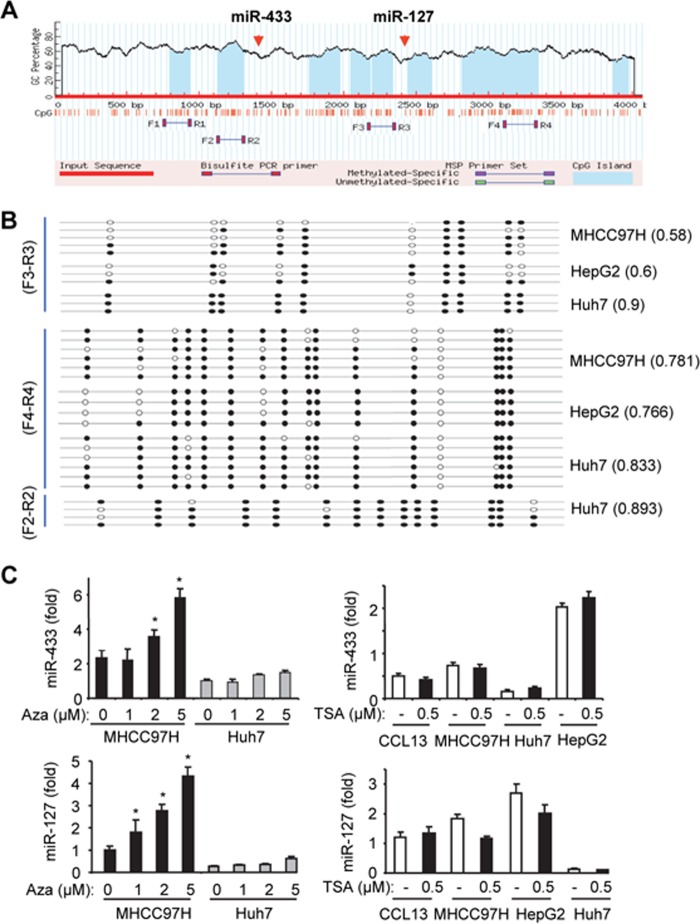
DNA methylation regulates miR-433 expression in HCC cells. A, miR-433 resides in the CpG-rich region in the genomic locus. The genomic sequence containing miR-433 and miR-127 was uploaded and analyzed using MethPrimer. The blue areas indicate predicted CpG islands. Primers were designed to cover the CpG islands surrounding miR-433 and miR-127 for methylation analysis. B, methylation profile in MHCC97H, HepG2, and Huh7 cells using primer sets F3/R3, F4/R4, and F2/R2. Black and white circles denote methylated and unmethylated cytosines in specific CpGs, respectively. Three to six clones from each cell line were analyzed. The numbers following each cell line indicate methylated CpGs out of the total CpGs that were sequenced. C, qPCR analysis of miR-433 (upper) and miR-127 (lower) levels in HCC cells treated with the demethylating agent 5′-aza-2′-deoxycytidine (Aza; 24 h; left) or the histone deacetylase inhibitor trichostatin A (TSA; 24 h; right). Data are expressed as means ± S.D. of triplicate assays. *, p < 0.01, significant difference versus the untreated group. Error bars represent S.E.

