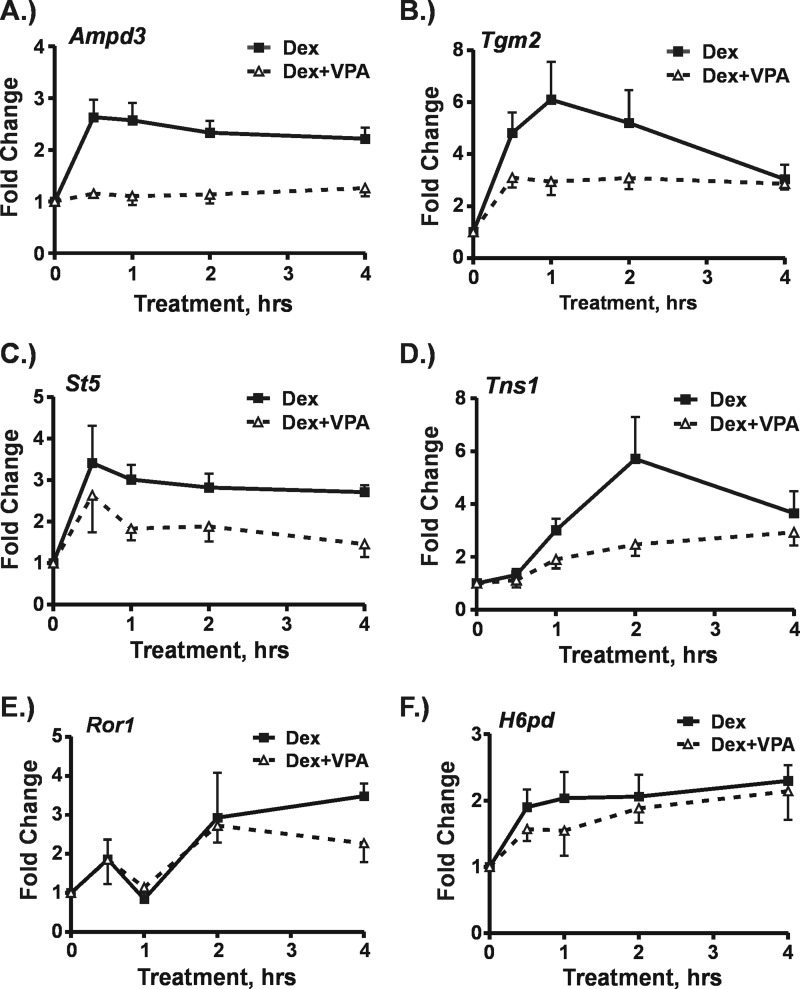
FIGURE 3.
Effects of VPA on Dex-induced transcription. Hepa-1c1c7 cells were treated with either Dex (100 nm) or a combination of VPA (5 mm) plus Dex. In the latter, cells were exposed to VPA for 1 h prior to the addition of Dex. Cells were harvested at 30, 60, 120, and 240 min after Dex addition. RNA was isolated and subjected to RT-qPCR using intron-exon primers sets to measure nascent transcripts. The graphs represent -fold changes in nascent transcripts for each treatment time relative to levels in untreated cells for the Ampd3 (A), Tgm2 (B), St5 (C), Tns1 (D), Ror1 (E), and H6pd (F) genes. The results shown were derived from three to five independent experiments. Error bars represent S.E.

