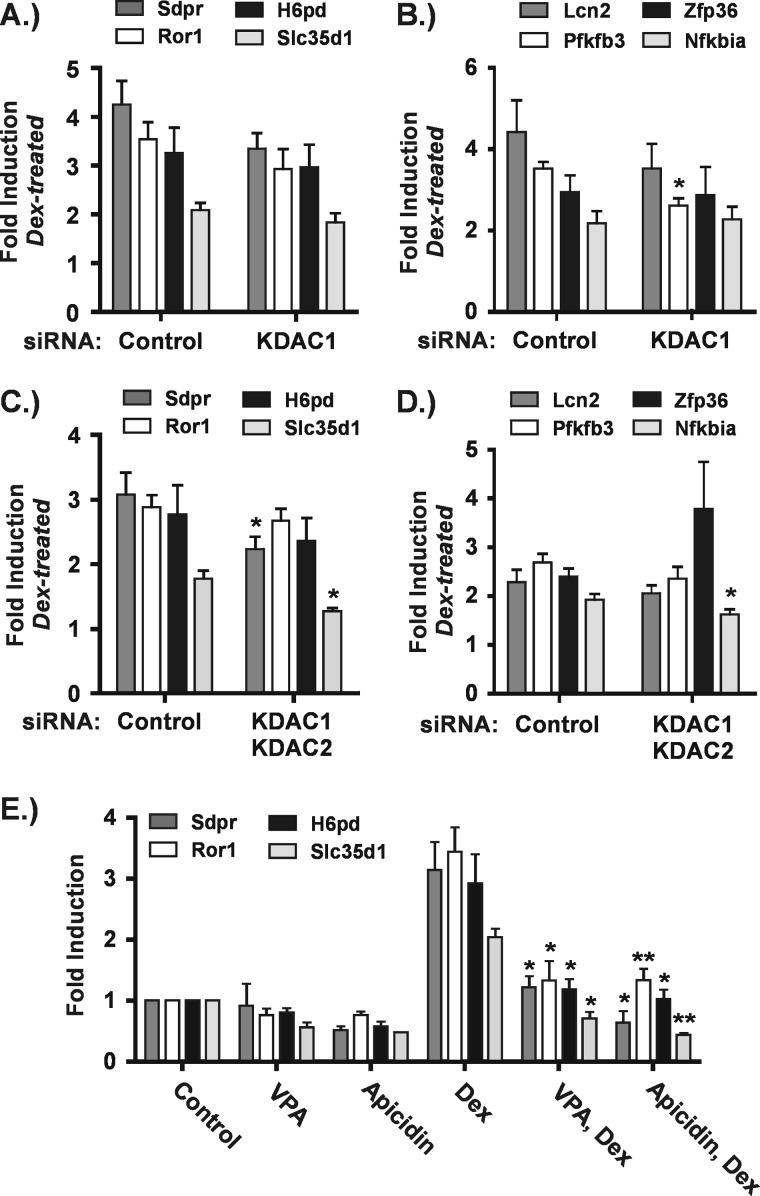
FIGURE 8.
Multiple KDACs cooperate in transactivation of some GR target genes. A–D, Hepa-1c1c7 cells were transfected with siRNAs and treated as described in the legend to Fig. 6. The graphs shown are a summary of four to five independent experiments and show -fold inductions in the presence of Dex relative to the corresponding untreated control for cells transfected with control or KDAC1 siRNAs (A and B) or with control or KDAC1 plus KDAC2 siRNAs (C and D). Asterisks denote significant changes between Dex-treated cells transfected with siRNAs targeted against KDACs relative to control siRNA. E, Hepa-1c1c7 cells were treated as described in the legend to Fig. 4. The graph shows a summary of three to five independent experiments and represents -fold changes relative to untreated cells. Asterisks indicate a significant change under the combination treatments relative to Dex alone as determined using the paired t test. *, p ≤ 0.05; **, p ≤ 0.01. Error bars represent S.E.

