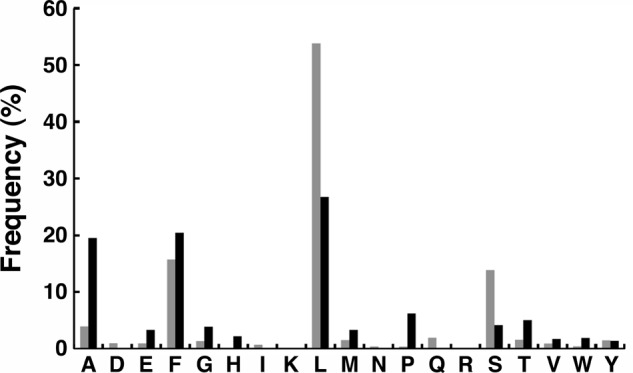
FIGURE 3.

N-terminal sequencing of the total pool of proteins pulled down by ClpS. Proteins from cell lysates of MG1655 (gray bars) or MG1655 dps− (black bars) were bound and eluted from a ClpS column. They were then precipitated with TCA and dissolved in 4% SDS. The solubilized proteins were spotted on PVDF membranes and after washing the spots with methanol solutions to remove SDS subjected to a single round of Edman sequencing. Individual amino acids are expressed as a percentage of the total amino acids in the first position. The N-degrons, leucine and phenylalanine, are dominant in both samples.
