
FIGURE 6.
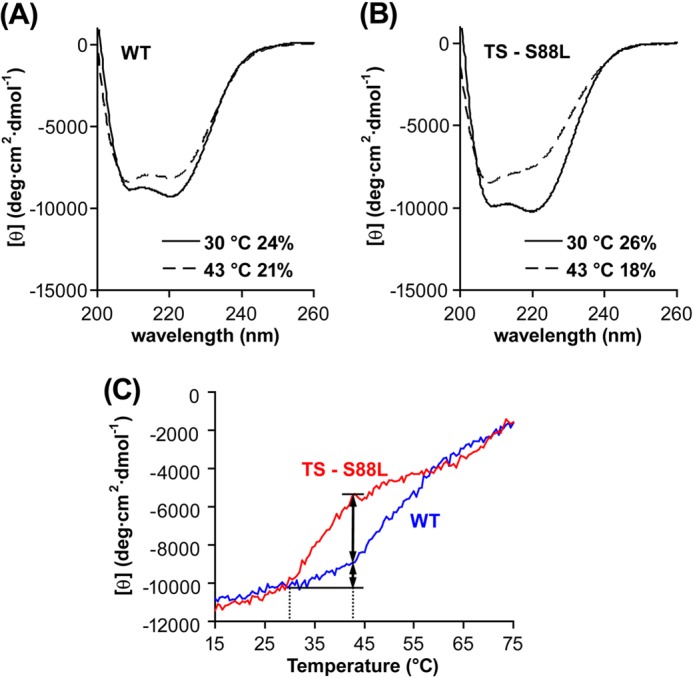
CD spectra of TrmD enzymes. A, CD spectra of the WT enzyme at 30 °C (solid line) and 43 °C (dotted line). B, CD spectra of the S88L mutant enzyme at 30 °C (solid line) and 43 °C (dotted line). C, CD spectra of the WT and mutant enzymes over a temperature scan. The spectrum of each enzymes (at 0.1 μm) in the CD buffer was recorded from 15 to 75 °C at 222 nm, with temperature rise at 24 °C/h, response time at 32 s, and bandwidth at 1 nm. In A and B, the content of α-helix at each temperature was calculated and shown as a percentage.