FIGURE 4.
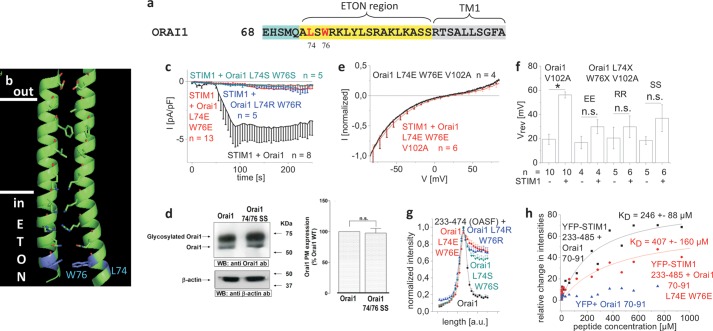
The hydrophobic residues Leu-74 and Trp-76 of the ETON region contribute in a concerted manner to the coupling with STIM1. a, amino acid sequence of Orai1 N terminus displaying Leu-74 and Trp-76 in red in the conserved ETON region (yellow area) b, schematic representation of two TM1 domains + ETON regions highlighting Leu-74 and Trp-76 (blue) in the ETON region. c, time course of whole cell inward currents at −74 mV activated by passive store depletion of HEK 293 cells co-expressing CFP-STIM1 and YFP-Orai1 L74S/W76S, YFP-Orai1 L74E/W76E, and YFP-Orai1 L74R/W76R in comparison with wild-type YFP-Orai1. pF, picofarads. d, Orai1 plasma membrane expression in HEK293 cells, expressing Orai1 WT in comparison with Orai1 L74S/W76S determined by biotinylation as described under “Experimental Procedures” (n = 5; *, p < 0.05). Error bars indicate S.E. e, I/V relationship of normalized Orai1 V102A currents in comparison with that of Orai1 L74E/W76E/V102A, shown as example. Error bars indicate S.E. n.s., not significant. WB, Western blot; ab, antibody. f, block diagram displaying reversal potentials of Orai1 V102A, Orai1 L74S/W76S/V102A (SS), Orai1 L74E/W76E/V102A (EE), and Orai1 L74R/W76R/V102A (RR) in the absence and presence of STIM1 (*, p < 0.05). Error bars indicate S.E. g, intensity plots representing the localization of STIM1 233–474 (OASF) across the cell when co-expressed with Orai1 L74S/W76S, Orai1 L74E/W76E, and Orai1 L74R/W76R when compared with wild-type Orai1. a. u., arbitrary units. h, binding curve fitted to a one-site binding model for YFP-STIM1 233–485 from a HEK293 cell lysate together with Orai1 NT(aa70–91) or Orai1 NT(aa70–91 L74E/W76E) in comparison with YFP from HEK293 cell lysate together with Orai1 NT(aa70–91), obtained from thermophoresis measurements.

