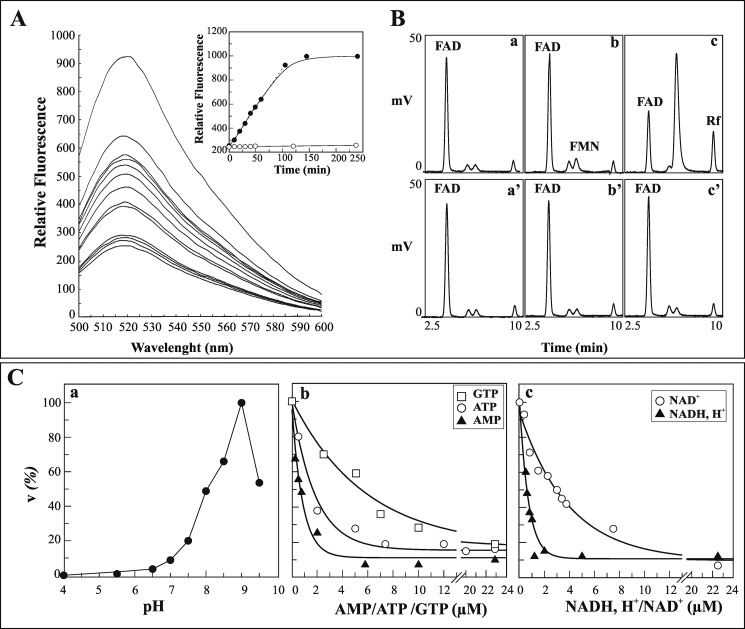
FIGURE 7.
FAD hydrolysis by isolated rat liver nuclei. A, rat liver nuclei (0.1 mg of protein) were incubated for 1 min as described under “Experimental Procedures,” and then 5 μm FAD was added. Flavin fluorescence emission spectra were monitored at different incubation times. In the inset, the fluorescence measured at 520 nm, as obtained either in the absence (●) or presence (○) of 5 mm EDTA, was plotted against time. B, chromatographic evidence of FAD hydrolysis catalyzed by pure nuclei. FAD, FMN, and Rf were revealed by HPLC in nuclear extracts obtained after 0 min (chromatograms a and a′), 4 min (chromatograms b and b′), and 120 min (chromatograms c and c′) of incubation with FAD, either in the absence (chromatograms a–c) or in the presence (chromatograms a′–c′) of 5 mm EDTA. C, some features of FAD hydrolysis are reported. The rate of FAD hydrolysis by pure nuclei (0.4 mg of proteins) was measured fluorimetrically. In chromatogram a, the pH profile of the rate of FAD (5 μm) hydrolysis is shown. 100 mm acetate/acetic acid and 50 mm Tris-HCl (with 5 mm MgCl2) at different pH values were used as buffering mixtures. A specific calibration curve was obtained at each pH value as described under “Experimental Procedures.” The values are reported as percentages of the maximum rate (6.3 nmol·min−1·mg−1 of protein) arbitrarily set equal to 100%. The inhibition by externally added GTP, ATP, and AMP (chromatogram b) or NADH and NAD+ (chromatogram c) on the rate of FAD (0.6 μm) hydrolysis is shown. The data shown in chromatograms b and c were fitted according to a single exponential decay equation using the Grafit software (version 3.00; Erithacus Software).

