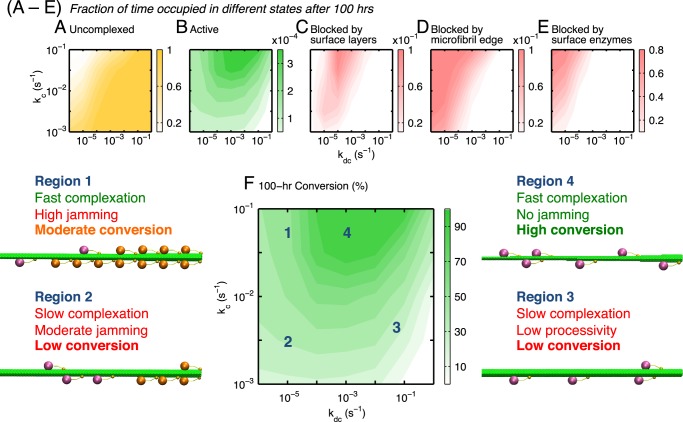
FIGURE 6.
Maps of fractional occupancy times (A–E) and productivity of conversion (F) in the complexation-decomplexation (kc − kdc) plane. The fractional occupancy time for a state is its occupancy time divided by the total reaction time. Four kinetics regions are identified in the productivity map of F, and a representative snapshot from a SLATE simulation is shown for each region. Enzymes in the blocked state are colored orange. The kinetic characteristics of each region are also described.

