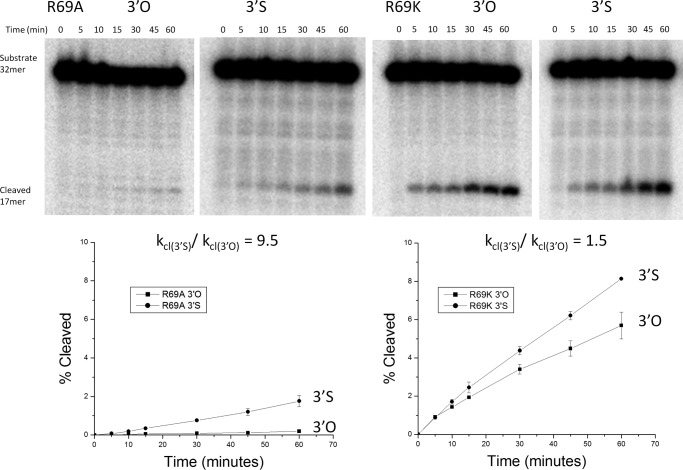
FIGURE 5.
Cleavage assay with Sin R69A and R69K. Upper, representative denaturing gels showing the time courses of DNA cleavage by Arg-69 mutants. Lower, plots showing the percentage DNA cleaved versus time by R69A (left) and R69K (right). The averages ± S.D. (error bars) from two replicates are shown. Lines shown on the plots simply connect the points to aid the eye; see Table 1 for the slopes and errors resulting from fitting these points to a straight line.

