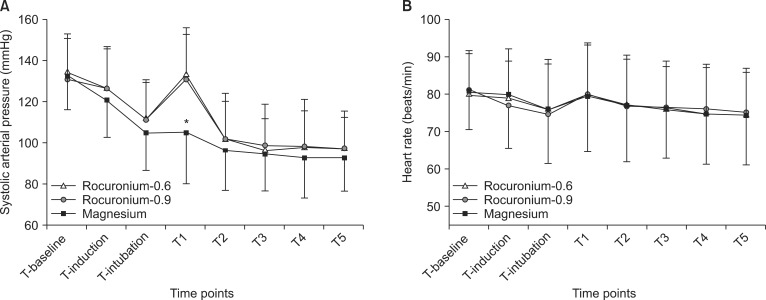
Fig. 3.
Changes in systolic arterial pressure (A) and heart rate (B) in the three groups. Rocuronium-0.6 group: 0.6 mg/kg rocuronium, Rocuronium-0.9 group: 0.9 mg/kg rocuronium, Magnesium group: 0.6 mg/kg rocuronium with magnesium sulphate pretreatment, T-baseline: before magnesium sulphate or normal saline was administered, T-induction: before induction, T-intubation: before intubation, T1, T2, T3, T4, and T5: 1, 2, 3, 4, and 5 min after intubation, respectively. *P < 0.05 compared with the rocuronium-0.6 and the rocuronium-0.9 group.

