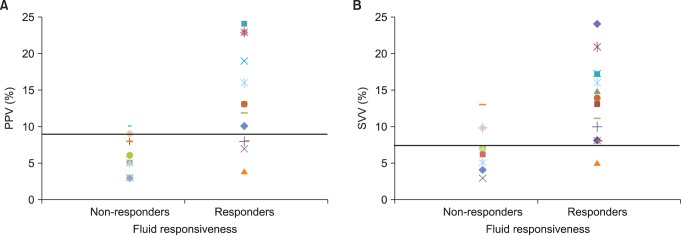
Fig. 4.

Dot diagram plot for (A) PPV and (B) SVV of responders (Rs) and non-responders (NRs). Each symbol represents individual values of PPV and SVV before fluid loading. Horizontal straight line represents the optimal threshold values in predicting fluid responsiveness. A PPV ≥ 9.5% identified Rs with a sensitivity of 71.4% and a specificity of 90.9%, and a SVV ≥ 7.5% identified Rs with a sensitivity of 92.9% and a specificity of 63.6%. PPV: pulse pressure variation, SVV: stoke volume variation.
