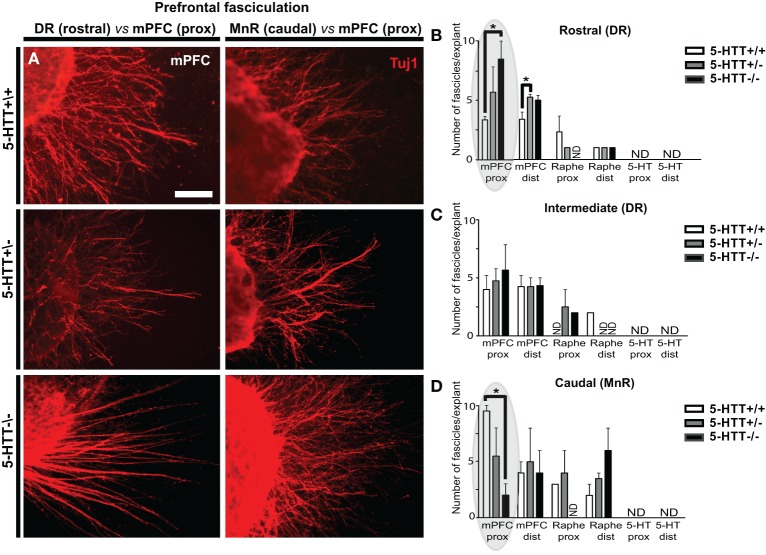
Figure 3.
The amount of 5-HTT during development influences mPFC fasciculation. (A) Examples of differences in number of fascicles per explant in WT, 5-HTT+/− and 5-HTT−/− mPFC (proximal quadrant) co-cultured with the rostral (DR, left panels) or caudal subarea (MnR, right panels). Scale bar represents 50 μm. (B–D) Quantification of the number of mPFC fascicles (>5 μm) per explant, for the different subareas and genotypes in both the proximal (prox) and distal (dist) quadrant. Gray ovals in (B,D) indicate the example given on the left. Graphs show average number of fascicles (>5 μm) per explant ± SEM. One-Way ANOVA (α = 0.05), *p < 0.05.

