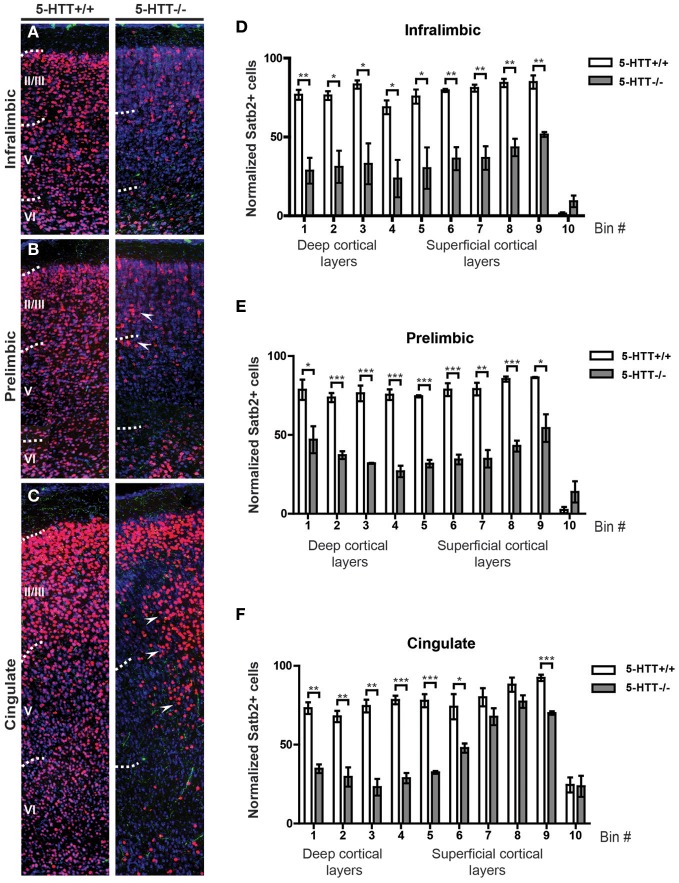
Figure 6.
Projection neuron identity is altered in absence of the 5-HTT during development. (A) Coronal sections immunostained for 5-HT (green), Satb2 (red) and counterstained with fluorescent Nissl (blue) of 5-HTT+/+ and 5-HTT−/− IL showing the position of callosal projection neurons (presumptive layer II-V). (B) Coronal sections of the PL as in (A). (C) Coronal sections of the Cg as in (A). Arrowheads indicate clusters of misplaced neurons. (D) Quantification of the number of Satb2-positive cells in 10 bins dividing the IL confirming the qualitative observations as seen in (A). (E) Quantification of the number of Satb2-positive cells in 10 bins dividing the PL confirming the qualitative observations as seen in (B). (F) Quantification of the number of Satb2-positive cells in 10 bins dividing the Cg confirming the qualitative observations as seen in (C). There is a significant decrease in the number of Satb2-positive cells in the IL, PL, and Cg of 5-HTT−/− compared to 5-HTT+/+ (p < 0.05–0.001). Graphs show average number of Satb2-positive cells per bin ± SEM. One-Way ANOVA (α = 0.05), *p < 0.05, **p < 0.01, ***p < 0.001.

