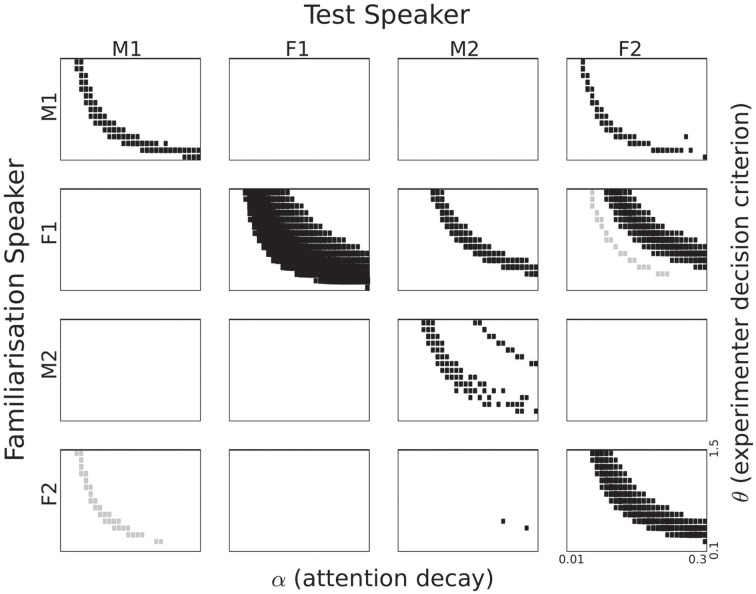
Figure 7.
Listening time differences for all speaker pairings based on cluster activation. The section of the parameter space displayed corresponds to 0.1 to 1.5 for θ and 0.01 to 0.3 for α. Rectangle size corresponds to the p-value in a two-sample t-test. Black rectangles correspond to a familiarity preference; grey rectangles to a novelty preference.

