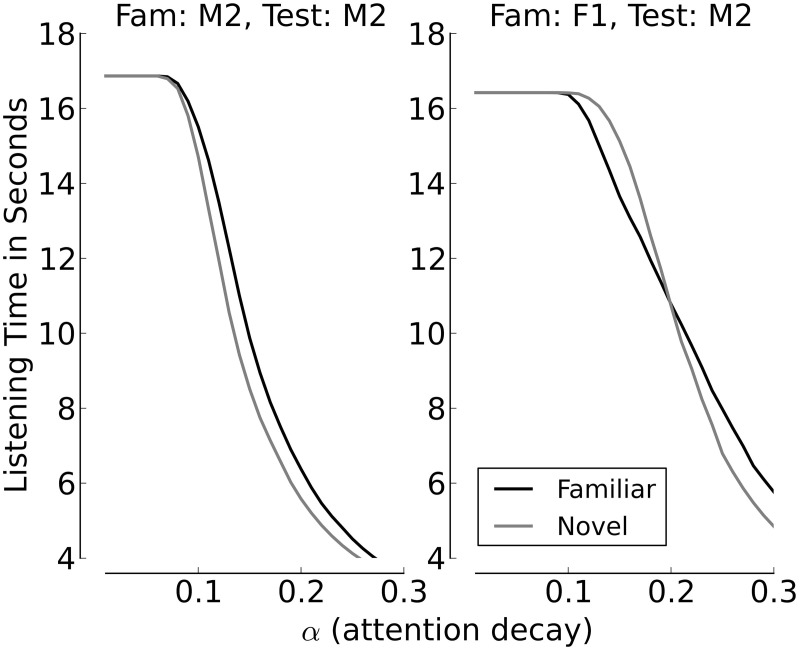
Figure 9.
Listening times (in seconds) across the whole range of values for α, with θ = 0.3. The left panel shows the listening times when the same speaker, M2, utters familiarization and test stimuli, the right panel shows listening times and when Speaker F1 utters the familiarization stimuli and Speaker M2 the test items.

