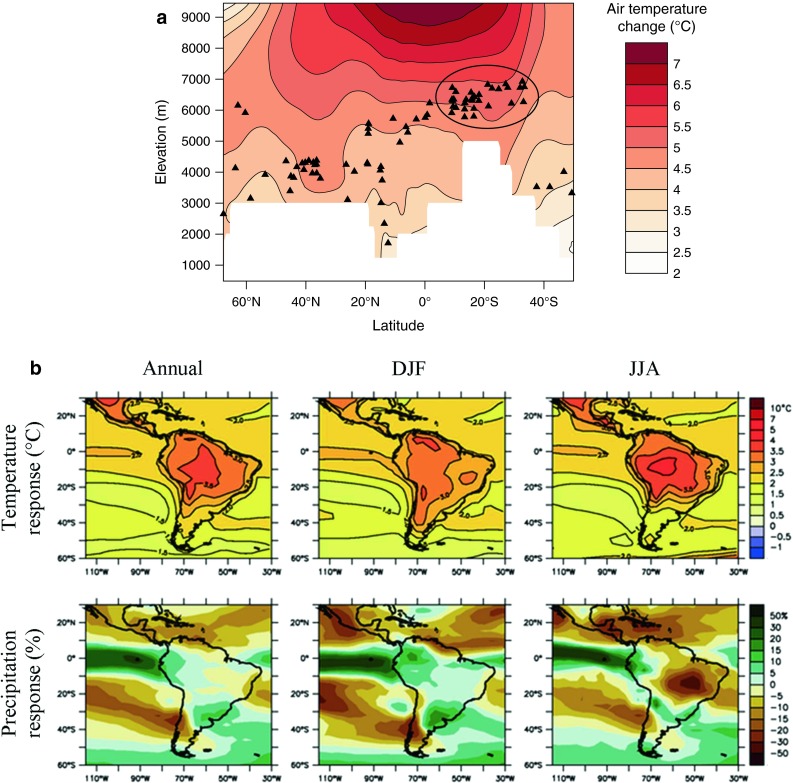
Fig. 1.

a Visual representation of predicted global warming (adapted from Bradley et al. 2006, p. 1755). Projected changes in mean annual free-air temperatures between (1990–1999) and (2090–2099) along transect from Alaska (68°N) to southern Chile (50°S) using the mean of eight different Global Climate Models (IPCC using CO2 levels from scenario A2). Black triangles symbolize the highest mountains for each latitude; with the highest air temperature change predicted, the South American Andes are circled. b Temperature and precipitation changes over South America from the MMD-A1B simulations (IPCC 2007a, p. 895). Top row (i) Annual mean, (ii) December January February, and (iii) June July August temperature change between 1980–1999 and 2080–2099, averaged over 21 models. Bottom row shows the same as top, but for fractional change in precipitation
