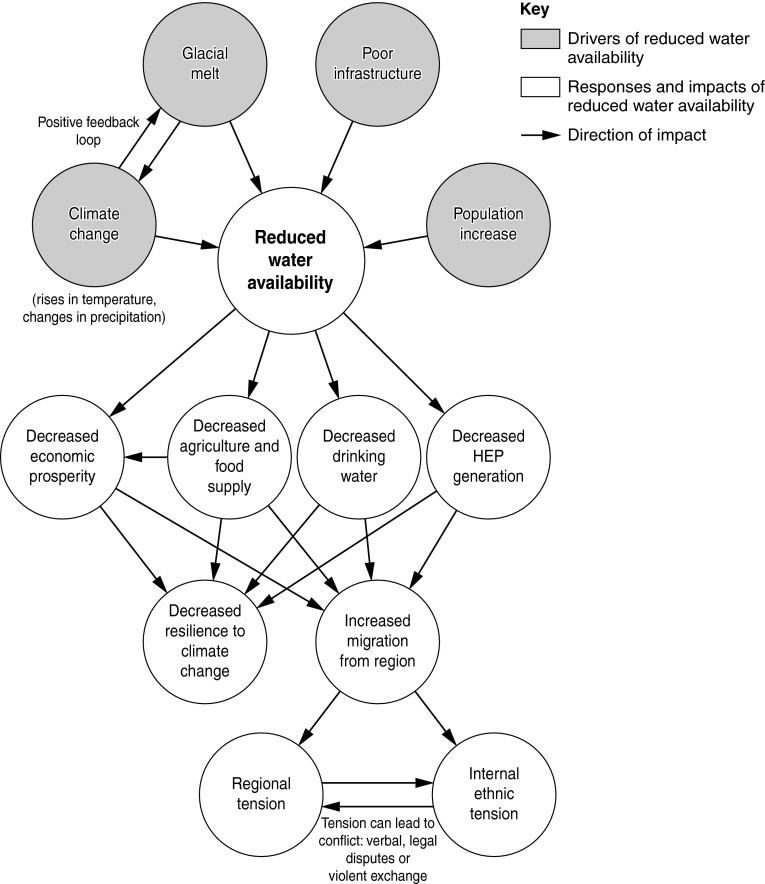
Fig. 4.
Network diagram outlining the drivers of Bolivian water scarcity and impact relationships (adapted from Stewart 2010). Gray circles represent drivers of reduced water availability and white circles represent the responses of reduced water availability and further impacts

