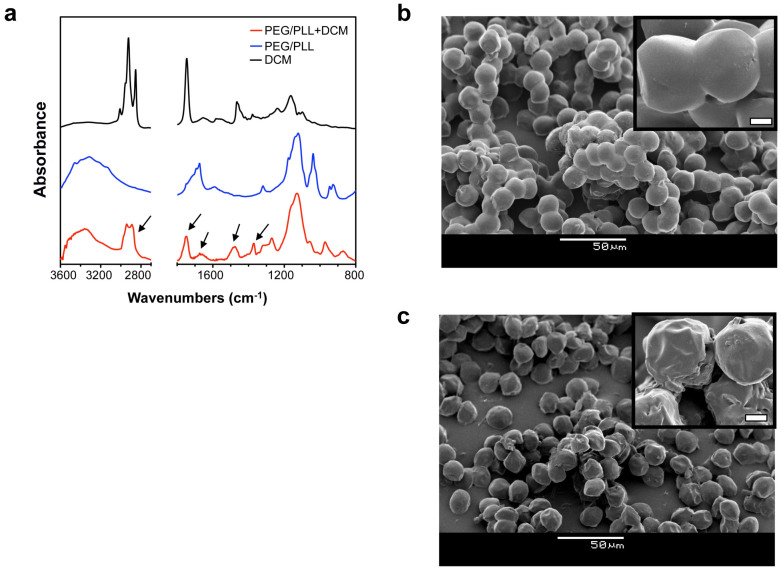
Figure 4. Characterization of PEG-co-PLL + DCM microbeads.
(a) FT-IR spectra of PEG-co-PLL + DCM microbeads, PEG-co-PLL microbeads, and DCM. (b), (c) SEM images of lyophilized PEG-co-PLL and PEG-co-PLL + DCM microbeads, respectively. The insets high magnification images show the surface morphologies of the microbeads. The scale bar of the inset images is 2 μm.

