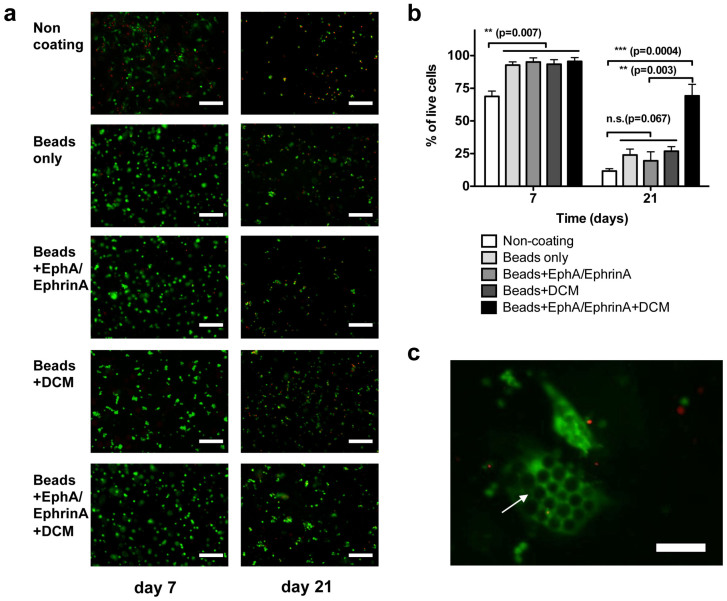
Figure 5. Live/dead cell viability assay of pancreatic β-cells cultured with various PEG-co-PLL microbeads at day 7 and day 21.
(a) Optical fluorescent images of β cell cultured with various types of PEG-co-PLL microbeads. Cells cultured conventional polystyrene substrate was used as control (non-coating). The cells were stained with calcein AM (green) and Ethidium homodimer-1 (red). (b) Quantitative analysis of live/dead cell viability of cells cultured in the various types of microbeads. n = 4. The error bars represent the s.d. of three measurements. (c) Fluorescent image of aggregation of β-cells (green color) and the microbeads (dark color, indicated by the arrow) underneath the cells. The scale bar is 200 μm in a, and 100 μm in c, respectively.

